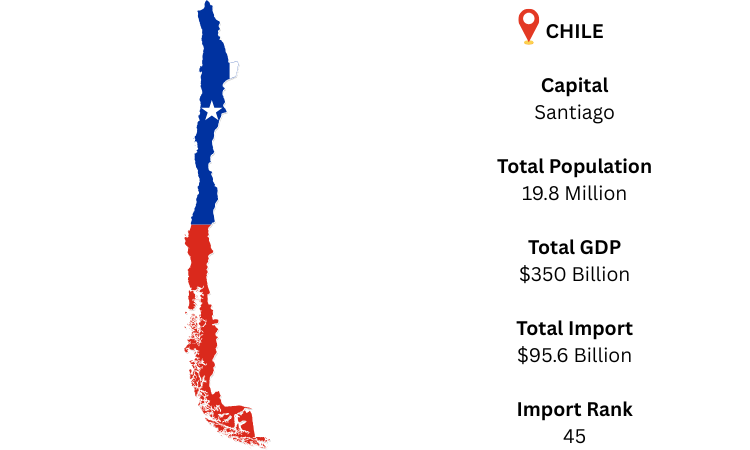
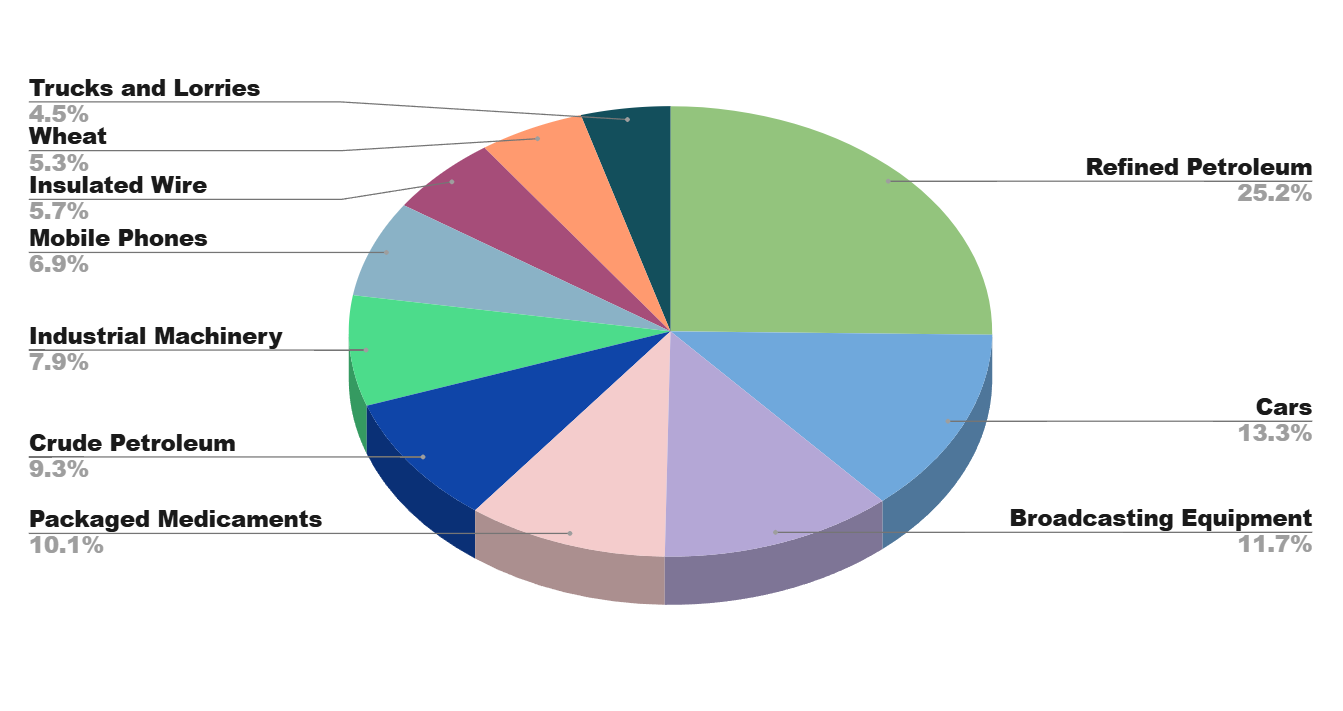
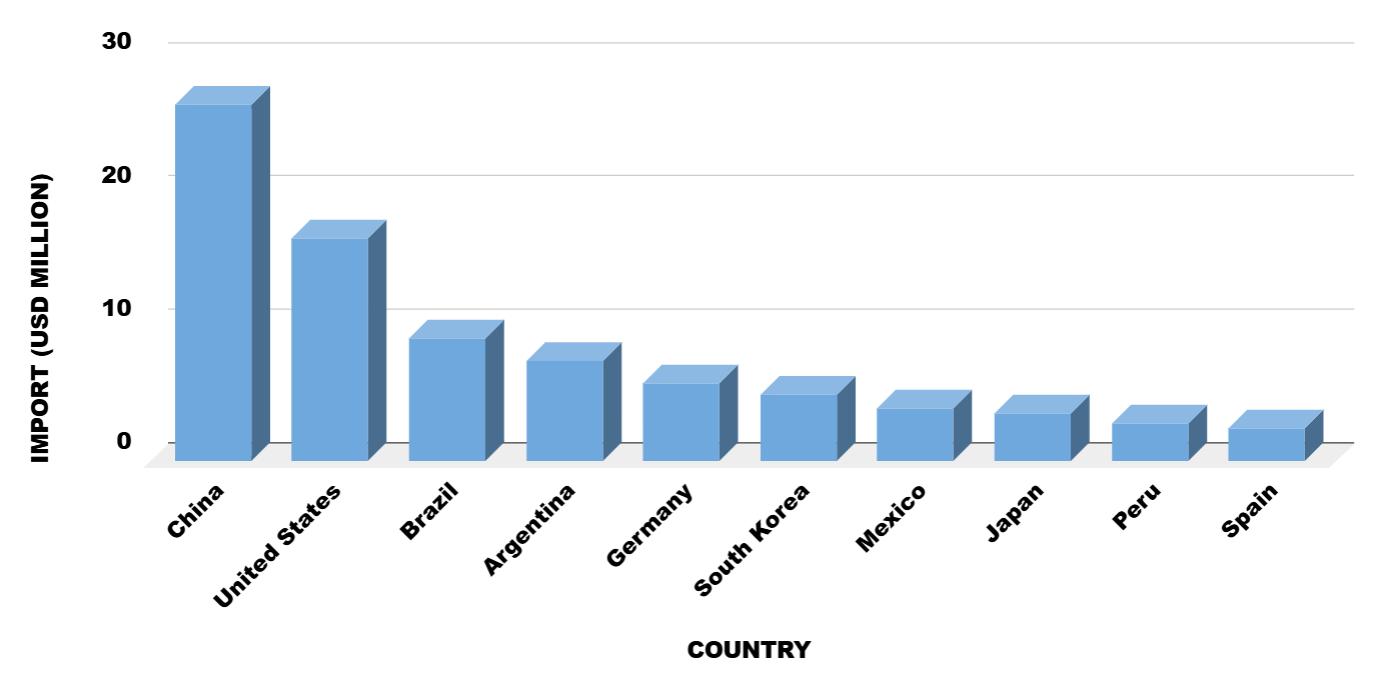
Chile Import Data

Chile Import Data

Chile in the Western Seaboard of South America is bound by Peru, Bolivia, and Argentina in the north and east direction and leads to the Pacific Ocean in the west.  The country has a long coastline with the Pacific Ocean which increases the land’s fertility and spans over an area of 6,435 kilometres. The government has an abundance of natural wonders ranging from mountains, forests, and beaches to deserts. The majority of the population from its 18 million resides in the deserts of Northern Chile and the central part of the country mainly in the larger cities like Santiago.

The rich history of the nation dates back thousands of years and represents the culture and traditions of the indigenous tribes that inhabited there long ago like the Mapuche and Inca. The land areas of the nation are divided into 3 major regions the intermediate depression, the longitudinal valley, and the Coastal ranges.  The rapidly advancing industrial and agricultural sector of the nation has recorded a GDP of 340 billion US dollars in 2023 with a growth rate of 4.5% from 2022 along with an import trade value of 77 billion US dollars in 2023 says the Chile Customs Shipment Data.

Chile Import Customs Trade Data Shows Top 10 Importing Products In 2023 – Analysis By Chapter

  • 17.9 billion US dollars with a share of 21%: HS Code -27 - Mineral fuels and oils
  • 10.4 billion US dollars with a share of 12.1%: HS Code - 84 - Nuclear reactors and boilers
  • 8.5 billion US dollars with a share of 9.94%: HS Code - 85 - Electrical machinery and equipment
  • 8.08 billion US dollars with a share of 9.45%: HS Code - 87 - Vehicles
  • 1.74 billion US dollars with a share of 9.03%: HS Code - 90 – Optical instruments
  • 2.52 billion US dollars with a share of 2.95%: HS Code - 39 - Plastics and its articles
  • 2.24 billion US dollars with a share of 2.62%: HS Code - 30 - Pharmaceutical goods
  • 1.99 billion US dollars with a share of 2.33%: HS Code - 02 - Meat
  • 1.63 billion US dollars with a share of 1.91%: HS Code - 73 - Iron or steel
  • 1.51 billion US dollars with a share of 1.77%: HS Code -28 – Chemicals

Chile Import Global Trade Data Shows Top 10
Trading Partners
of Chile

  • China holds a share of 23% worth 19.8 billion US dollars
  • USA holds a share of 20% worth 17.1 billion US dollars
  • Brazil holds a share of 10.2% worth 8.77 billion US dollars
  • Argentina holds a share of 6.69% worth 5.72 billion US dollars
  • Germany holds a share of 3.28% worth 2.81 billion US dollars
  • Japan holds a share of 2.87% worth 2.46 billion US dollars
  • Areas, nes holds a share of 2.53% worth 2.16 billion US dollars
  • Spain holds a share of 2.15% worth 1.84 billion US dollars
  • Peru holds a share of 2.13% worth 1.82 billion US dollars
  • Mexico holds a share of 1.96% worth 1.68 billion US dollars

Chile Import Data Sample

HOW IMPORT GLOBALS CHILE IMPORT DATA IS BENEFICIAL FOR BUSINESS GROWTH 

Every business needs accurate and detailed information about importing goods from one country to another. The reliable information on import-export trade activity can be a game changer for your business. It helps in efficient business planning and allows making informed decisions about the potential market of your product, where you can grow your business rapidly.

Import Globals provides detailed information on Chile Import Trade by subscribing to Chile Trade Data you can get access to extensive detailed information on imports into the Chile market from the worldwide. Chile Trade Data includes all major columns such as Importers company, Exporters company, Product Description, HS Code, FOB, CIF, Net Weight, Quantity, ports, Origin Country, etc. This data gives you a well-rounded view of Chile's Import trade.

 Chile Import Customs Data is collected from the most authenticated documents such as customs shipping bills, bills of entries, bills of lading, customs invoices, etc... It ensures the reliability of the data. Whether you are a new player in the market or an established company it is very necessary to get trustworthy information for business planning. Chile Trade Statistics provided by Import Globals gives valuable insight into Chile's market to make informed decisions about potential partners.

By using Chile Import Shipment Data, you can stay ahead of market trends and competitors. You can save plenty of time and money in researching potential clients and the market of your product. Not only time and money you can also increase the chance of successful business planning and dealing with the help of Chile Trade Data. It is easier for companies to approach clients and negotiate confidently by using Chile Trade Statistics.

FIND OUT OTHER SOUTH AMERICA COUNTRIES IMPORT EXPORT DATA

Ask for Chile Import Sample Data and Demo

TOP