Russia Export Data

Russia Export Data

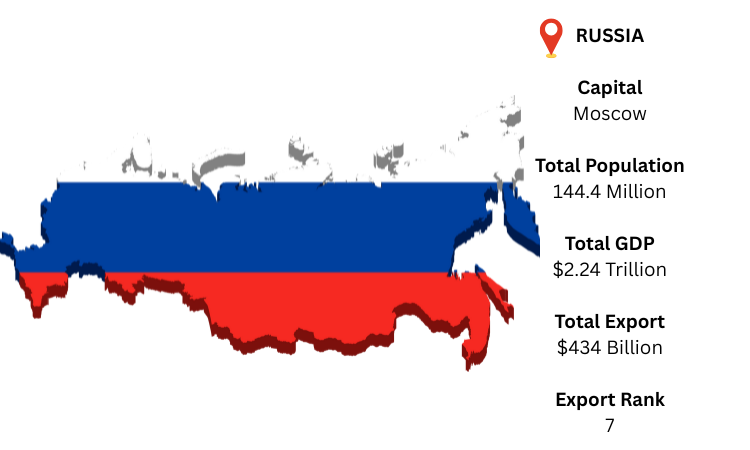
Russia is the largest country in the world with a total area of 17 million square kilometers. Russia is also known as the Russian Federation. The population growth in Russia is declining every year. In 2021, the Russian population reached to 146.7 million.

Russia GDP in 2021 was recorded $1.5 trillion, despite its declining population growth rate. In the year 2021, Russian ranks as the 11th largest exporters in the world, this positions reflects the country’s strong presence in the global trade market and ability to compete with any nations.

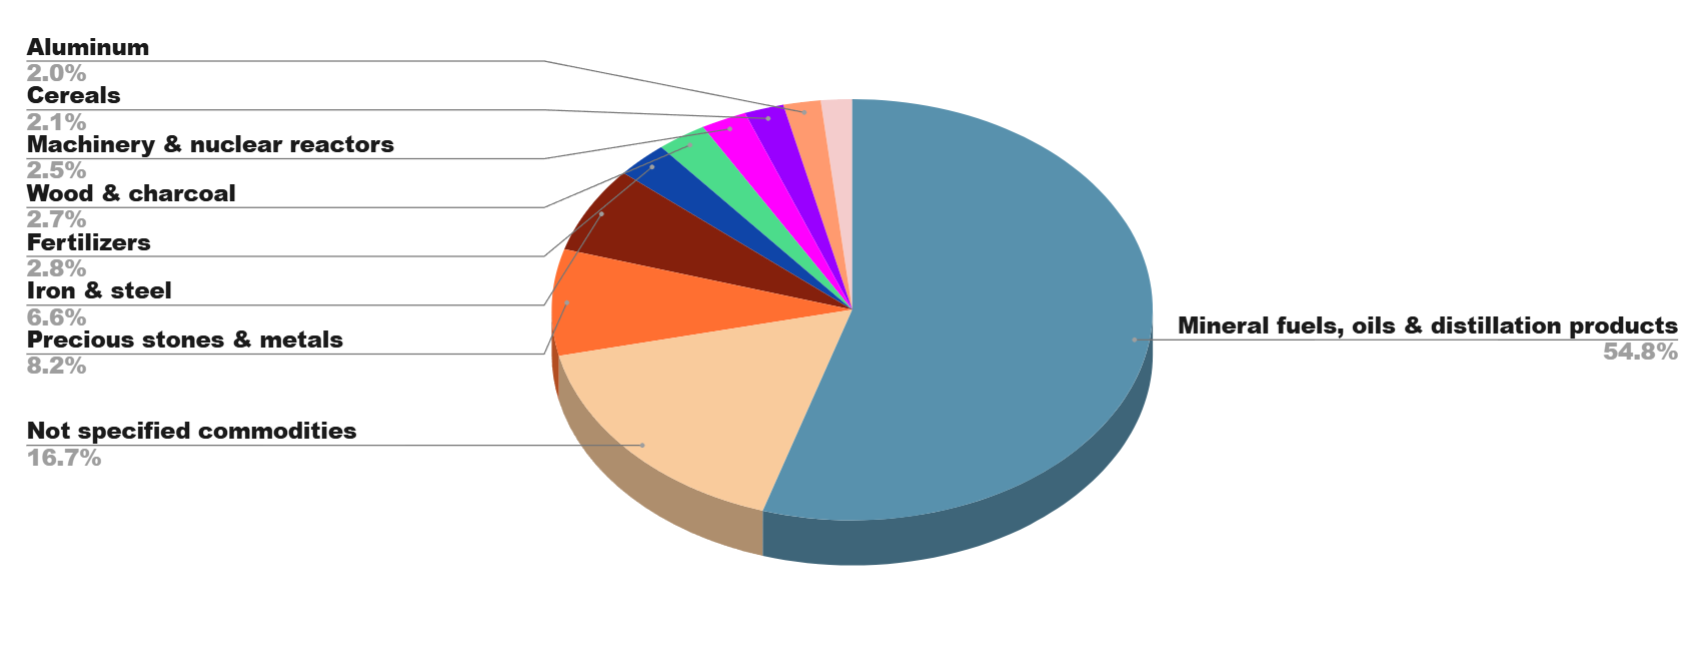
Russia is an energy-rich country that makes Russia a major players in the global oil and gas exports. In 2021, Russia export for over 60% crude oil to world making it the country’s top exported product. Other petroleum products are also top listed such as refined oils, natural gas and coal. Russia makes a significant revenue from exports.


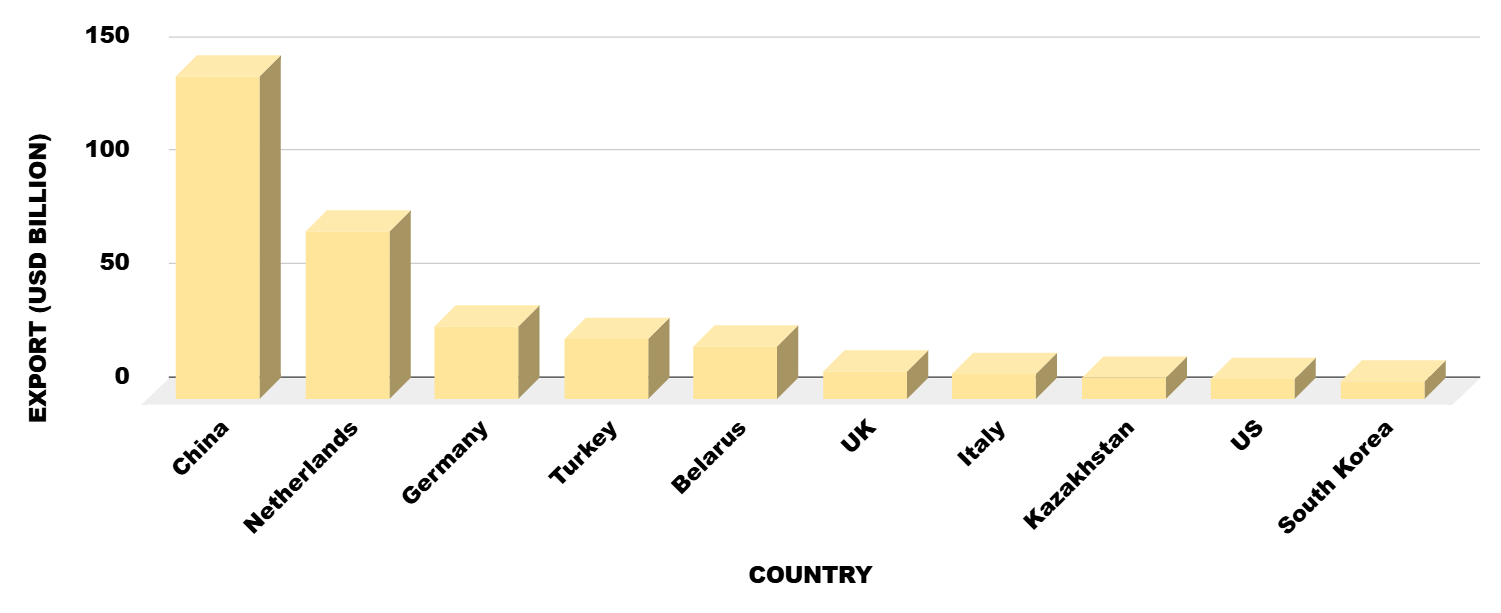
Russia to export destination in 2021, China with almost 14-15% of share alone. The other top export destination is due to geographical proximity such as Germany, Netherlands, Italy, Turkey and Belarus. In the recent years, a notable increase in trade between India and South Korea has been recorded. Russia is also expanding trade with Southeast Asia and Latin American countries such as Vietnam, Indonesia, Brazil and Mexico.

Russia Export Customs Trade Data Shows Top 10 Exporting Products In 2021 – Analysis By Chapter

  • 43% (212 billion US dollar) HS CODE: 27 - Fuels, oils, and products of their distillation; bituminous substances; mineral waxes
  • 14.8% (73 billion US dollar) HS CODE: 99 - Unspecified commodities
  • 6.41% (31 billion US dollar) HS CODE: 71 - Pearls, precious stones, precious metals, metals clad with precious metals, and articles thereof; imitation jewelry; coins
  • 5.86% (28 billion US dollar) HS CODE: 72 – Steel and Iron
  • 2.53% (12.4 billion US dollar) HS CODE: 31 - Fertilizers
  • 2.38% (11.7 billion US dollar) HS CODE: 44 - Charcoal made from wood and articles made from wood
  • 2.18% (10.7 billion US dollar) HS CODE: 84 - Parts of nuclear reactors, boilers, machinery, and mechanical appliances
  • 1.86% (9.17 billion US dollar) HS CODE: 10 - Cereals
  • 1.76% (8.66 billion US dollar) HS CODE: 76 - Articles made from Aluminium
  • 1.5% (7.42 billion US dollar) HS CODE: 26 - Slag, ash, and ores

Russia Export Global Trade Data Shows Top 10
Trading Partners
of Russia

  • A share of 13.9% (68 billion US dollars) was held by China
  • A share of 8.56% (42 billion US dollars) was held by The Netherlands
  • A share of 6.02% (29 billion dollars) was held by Germany
  • A share of 5.36% (26 billion US dollars) was held by Turkey
  • A share of 4.69% (23 billion US dollars) was held by Belarus
  • A share of 4.52% (22 billion US dollars) was held by the United Kingdom
  • A share of 3.91% (19.2 billion US dollars) was held by Italy
  • A share of 3.75% (18.4 billion US dollars) was held by Kazakhstan
  • A share of 3.6% (17.7 billion US dollars) was held by the USA
  • A share of 3.43% (16.8 billion US dollars) was held by Korea

Russia Export Data Sample

HOW IMPORT GLOBALS RUSSIA EXPORT DATA IS BENEFICIAL FOR BUSINESS GROWTH


It is very important for our business to get an accurate and detailed information of importing goods from one country to another. The reliable information of import export trade activity can be a game changer for your business. It helps in efficient business planning and allows to make informed decision about potential market of your product, where you can grow your business rapidly.

Import Globals provides detailed information of Russia Export Trade by subscribing to Russia Export Data you can get access to extensive detailed information on imports into Russian market from the worldwide. Russia Trade Data includes more than 90 fields, this data contains all major columns such as Importers company, Exporters company, Manufacturer company, Brands, Product Description, HS Code, FOB, CIF, Net Weight, Quantity, ports, Destination Country, Trading Country etc.. This data gives you well-rounded view of Russia Export trade.

Russia Export Statistics is collected from the most authenticated documents such as Custom shipping bills, bill of entries, bill of lading, Custom Invoices etc.. It ensures the reliability of the data. Whether you are new player in the market or established company it is very necessary to get trustworthy information for business planning. Russia Trade Statistics provided by Import Globals gives the valuable insight into Russian market to make informed decisions about potential partners.

By using Russia Export Shipment Data, you can stay ahead with market trends and competitors. You can save plenty of time and money in researching potential clients and market of your product. Not only time and money you can also increase the chance of successful business planning and dealing with the help of Russia Trade Data. It is easier for companies to approach client and negotiate confidently by using Russia Trade Statistics.

FIND OUT OTHER EUROPE COUNTRIES IMPORT EXPORT DATA

Ask for Russia Export Sample Data and Demo

TOP