Unveiling the USA's Top 10 Imported and Exported Products

- Apr 23, 2025
Unveiling the USA's Top 10 Imported and Exported Products
Discover the top 10 imported and exported products in the USA, key trading partners, and their respective trading values. Stay informed on trade dynamics.
Exploring the Significance of USA Trade Relations
The USA is the world's largest economy, so its trade relations are crucial for global economic stability. In terms of Annual GDP growth, the US economy grew by 2.5% in 2024, decreasing slightly from 3.2% in 2023.
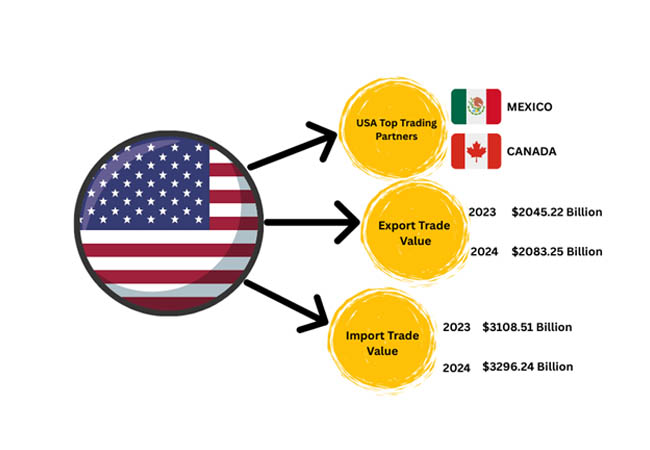
As of 2024, USA Total Trade (Exports + Imports) is $5,332.59 billion.
The USA's Top Trading Partners are Mexico and Canada.
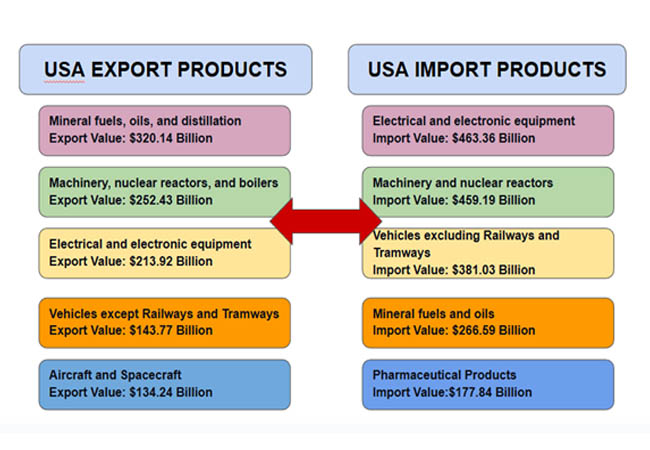
USA's Top Export Products are Mineral fuels, oils, and distillation, whose Export Value is $320.14 billion.
USA's Top Import Products are Electrical and Electronic Equipment, whose Import Value is $463.36 billion.
This blog provides a detailed explanation of the US Export-Import Global Trade Data. Let us dive deep into the US Import Export Trade Analysis!
US Top 10 Import and Export Products
The Global Trade Data provided by Import Globals shows that the US Total Exports are $3.191 trillion, and Total Imports are $4.110 trillion. Moreover, the US Trade Deficit has reached a record of $1.2 trillion as of 2024. The US goods and services contributed to a total Trade Deficit of $918 billion. Here is a detailed overview of the USA Import Export trade data. Let us know more about the USA's top 10 imported and exported products!
Major Export Products of the USA
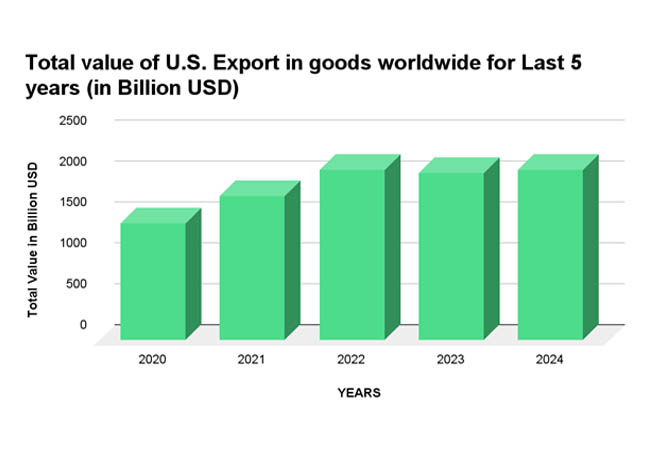
According to USA Export Data provided by Import Globals, the USA's Exports of goods increased from $38.6 billion to $2,083.8 billion in 2024. This USA exporter data will give you a clear view of the market. Here is a list of top export products along with their trading values:
1. Mineral fuels, oils, and distillation, HS Code: 27, [Export Value]: $320.14 Billion]: The US has become one of the world's major energy exporters after a huge expansion in the production of shale oil and gas. It sells crude oil, gasoline, refined petroleum products, diesel, and LNG to countries like Canada, the Netherlands, and South Korea.
2. Machinery, nuclear reactors, and boilers, HS Code: 84, [Export Value: $252.43 Billion]: According to United States Export data, the country has advanced engineering and innovation facilities such as General Electric, Honeywell, and Westinghouse. It produces heavy machinery and construction equipment, energy systems, and nuclear power technologies in Canada, Mexico, China, Germany, and Japan.
3. Electrical and electronic equipment, HS Code: 85, [Export Value: $213.92 Billion]: The US manufactures microchips, semiconductors, routers, satellites, fiber optics, computers, Integrated Circuits, and servers. This equipment is exported to Mexico, Canada, and Japan.
4. Vehicles except Railways and Tramways, HS Code: 87, [Export Value: $143.77 Billion]: The US exports American Brands' cars and automotive parts to Canada, China, and Mexico.
5. Aircraft and Spacecraft, HS Code: 88, [Export Value: $134.24 Billion]: Giant American firms like Boeing supply aircraft parts to France, Germany, and Brazil. Aerospace has become a booming industry for the USA exports.
6. Optical/ photo/ technical/medical apparatus, HS Code: 90, [Export Value: $106.29 Billion]: US firms deliver cutting-edge medical and optical equipment such as CT scanners, laser surgery tools, endoscopy tools, and MRI machines to Germany, Canada, and Japan.
7. Pharmaceutical Products, HS Code: 30, [Export Value: $94.39 Billion]: The USA's Import Export Trade Analysis states that its pharmaceutical industry produces high-quality medicines and medical devices, such as cancer medicines, medical and surgical tools, heart stents, etc, worldwide. Its leading export destinations are Belgium, the Netherlands, and Japan.
8. Plastics, HS Code: 39, [Export Value: $80.08 Billion]: The US export-import global data suggests that it supplies raw plastic, resins, pellets, and polymers. It is one of the world's largest producers of plastic materials and finished goods. Major Export Destinations are Mexico and China.
9. Precious stones/pearls/metals/coins, HS Code: 71, [Export Value: $73.07 Billion]: The USA exporter data says that the country is the core center for crafting, processing, and exporting precious stones and jewelry. Hong Kong, Switzerland, and India are the prime export destinations.
10. Organic Chemicals, HS Code: 29, [Export Value: $51.88 Billion]: Due to the USA's abundance of natural gas and advanced manufacturing facilities, it is one of the largest producers of organic chemicals in the world. China, Germany, and Japan are the leading export destinations.
Major Import Products of the USA
As per the USA Import Data provided by Import Globals, the USA's Imports of goods increased from $187.1 billion to $3,295.6 billion in 2024. This USA importer data will give you a crystal clear view of the US market. Here is a list of top imported products along with their trading values:
1. Electrical and electronic equipment, HS Code: 85, [Import Value: $463.36 Billion]: The US imports telecommunication equipment, microchips, semiconductors, routers, satellites, fiber optics, computers, and servers. This strengthens its technology and communications infrastructure.
2. Machinery and nuclear reactors, HS Code: 84, [Import Value: $459.19 Billion]: The US has been a key player in the energy sector, and imports in this category show the US's huge reliance on advanced machinery.
3. Vehicles excluding Railways and Tramways, HS Code: 87, [Import Value: $381.03 Billion]: The US is a major automotive market, and imports have a strong consumer base.
4. Mineral fuels and oils, HS Code: 27, [Import Value: $266.59 Billion]: There is a huge domestic production, despite the US imports crude oil and refined petroleum products to meet its energy demands.
5. Pharmaceutical Products, HS Code: 30, [Import Value: $ 177.84 Billion]: To support and strengthen its healthcare system, the US market equips itself with importing a variety of human and animal medicines.
6. Optical/ photo/ technical/medical apparatus, HS Code: 90, [Import Value: $118.32 Billion]: To make the healthcare facilities well equipped with the latest equipment and machinery, the US market imports a diverse range of medical tools.
7. Precious stones/pearls/metals/coins, HS Code: 71, [Import Value: $89.54 Billion]: Due to high consumer demand and for the investments sector, the US market imports diamonds, gold, and a variety of precious stones.
8. Plastics, HS Code: 39, [Import Value: $72.34 Billion]: To meet the demands of the manufacturing and packaging industry, the US imports plastic materials.
9. Furniture, Bedding, and Mattresses, HS Code: 94, [Import Value: $69.0 Billion]: Hospitality and Housing sector demands require the import of furniture.
10. Special Combined Nomenclature Commodities, HS Code: 99, [Import Value: $ 124.97 Billion]: This category of imports reflects the complexity of US Imports.
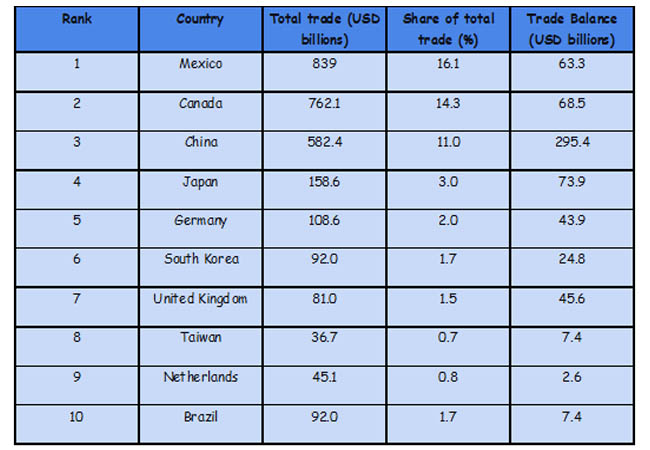
USA's Top 10 Trade Partners: A Comprehensive List
US Import Trends and Observations
The top trading partners of the USA accounted for 53.7% of total trade in goods in 2024. Whereas, 30.4% is solely contributed by Mexico and Canada. Moreover, the US and Mexico cooperated on workforce training in strategic sectors like automotive and semiconductors. However, there is an ongoing labor-related trade tension between the two. Still, the US total trade with Mexico reached $839.9 billion, making it a major trading partner.
China raised its tariffs on US goods to 84% in response to increased tariffs on Chinese imports to 125% by the US. This escalation resulted in a trade war between the two. The ongoing trade imbalance with China still showed a substantial trade volume poof $582.4 billion.
There is only one country, the Netherlands, which registers a trade surplus of $2.6 billion with the US.
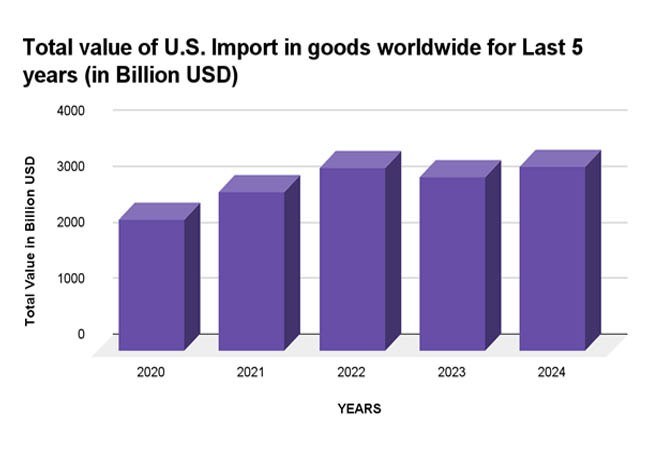
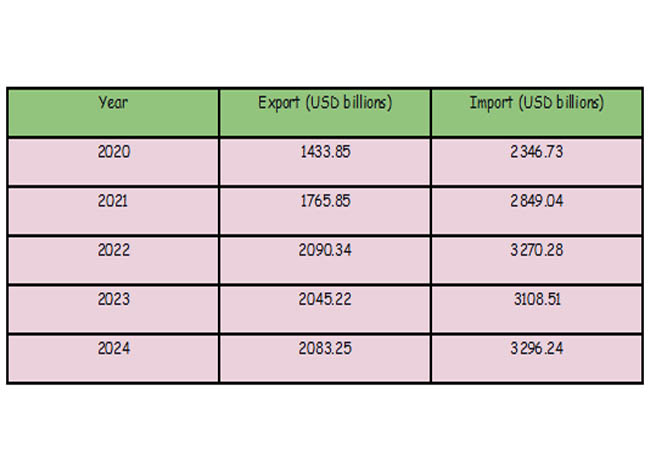
USA Imports and Exports in the last 5 years: A detailed statistical study
This table shows the total import and export values from the year 2020-2024.
US International Exports and Imports Overview: 2023 vs 2024
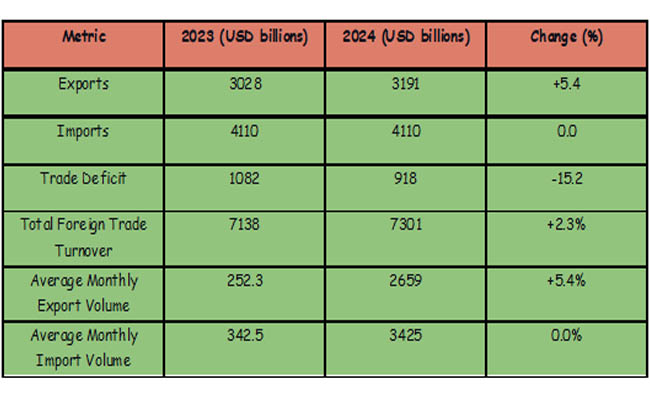
The US Trade Market provides invaluable insights, trends, and observations.
Trade Fluctuations: An overview of dips and spikes
Exports : Due to the influence of the strong US dollar and decreased demand, exports dipped by 0.7%, i.e., $261.7 billion. These declines were mainly spotted in industrial supplies and the automotive sectors.
Imports : There was a slight spike in household goods imports. Imports decreased by 0.3%, i.e., $336.7 billion.
Trade Deficit : In May 2024, the trade deficit expanded to $75.1 billion. This is the highest level since 2022.
Pricing Trends
The US market saw a decline in exports due to the strong US Dollar. American goods were selling at expensive prices abroad. As per the US Import Trade Analysis provided by Import Globals, there was a significant rise in the import prices of household goods.
Shipments and Logistics
According to USA Import Shipment Data provided by Import Globals, travel services contributed $0.3 billion to the US economy. Services exports saw a spike of $95.1 billion in 2024 from $1.0 billion. There were some ongoing challenges, such as labor shortages, particularly in the truck and railway sectors, and a slight rise in competition in air cargo services.
US Import and Export Trade Sectors, Forecast Trends, and Growth Drivers
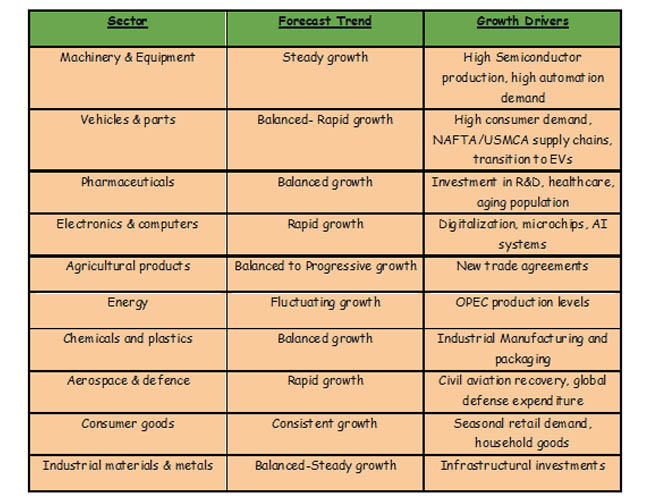
What Businesses should aim to navigate US trade opportunities?
There is a positive trend seen in outbound trade as US exports of goods saw a surge of $181.9 billion in 2024. As per the US Import Custom Data provided by Import Globals, the US market saw a rise with an average increase of $60.3 billion.
The average goods and services deficit rose by $50.1 billion in 2024. There are some strategic considerations for businesses to target the US trade market. Regularly review the US trade in goods and services reports. Research about the USA Import Trade Statistics of the US market.
Stay well informed about trade balances, sector-specific performances, and USA Import Export Trade Analysis. Make yourself well aware of supply chain developments to have a better understanding of movements and manufacturing processes. You can go through the USA Export Import Trade Data provided by Import Globals.
Conclusion
The detailed study about the U.S. international trade market suggests that amid global economic fluctuations, the US market reflects a steady and stable growth in exports and imports. Sectors like energy, advanced manufacturing, automotive, etc, continue their best to drive the outbound trade while fueling robust consumer demands.
FAQ's
Que. Which three goods are the leading exports from the United States?
Ans. Mineral fuels, oils, and distillation; machinery, nuclear reactors, and boilers; and electrical and electronic equipment rank as the top three exports from the United States.
Que. Which nation is the biggest trading partner of the United States?
Ans. In 2024, Mexico accounted for 16.1% of all trade, making it the United States' greatest trading partner.
Que. How much would the United States' trade deficit be worth in 2024?
Ans. Goods and services accounted for $918 billion of the record $1.2 trillion trade deficit in the United States in 2024.
Que. What is the most popular import into the United States?
Ans. With an import value of $463.36 billion in 2024, electrical and electronic equipment is the most expensive goods imported into the United States.
Que. Which industries are fueling the expansion of US exports?
Ans. The expansion of US exports is being driven by industries including electronics and computers, medicines, automobiles and parts, and machinery and equipment.
Que. Where to obtain detailed USA TRADE DATA?
Ans. Visit www.importglobals.com or email info@importglobals.com for more information on up-to-date USA TRADE DATA.
To learn more about the US Export and Import market, visit: