Indonesia Import Data

Indonesia Import Data

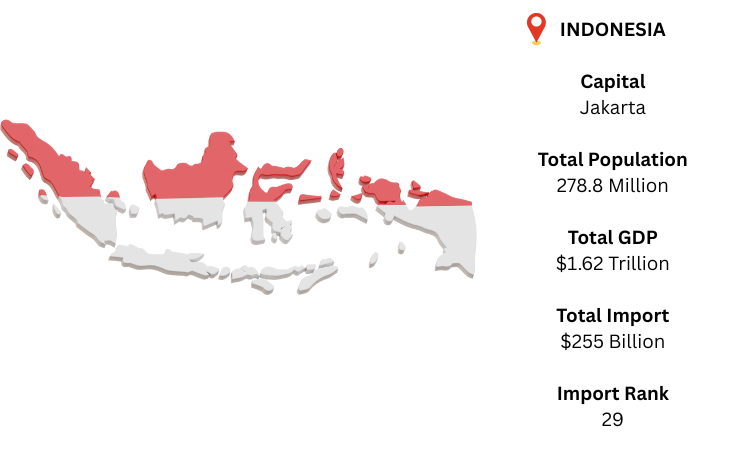
The import industry of Indonesia has been thriving globally for the present few days because of the increasing domestic acquisitions regarding different globally acquired necessities. The population of 270 million engaged in the consumer base has been continuously facilitating the overall import trade revenue by introducing a divergent range of acquired necessities to the trade management authorities. From 2019 onwards the country has been recording itself as the 24th largest importer of the world. The thriving import market has been playing a crucial role in the globally growing economy by maintaining a proper balance between the import and export authorities.

The growing import market has recorded a staggering rate of 189 billion US dollars in 2023, representing a sturdy hike in the total valuation of around 6% CAGR increase at present. The proactive contribution towards the active attraction of leading foreign investors is considered the key reason behind the increasing GDP of 1.06 trillion US dollars in 2023.

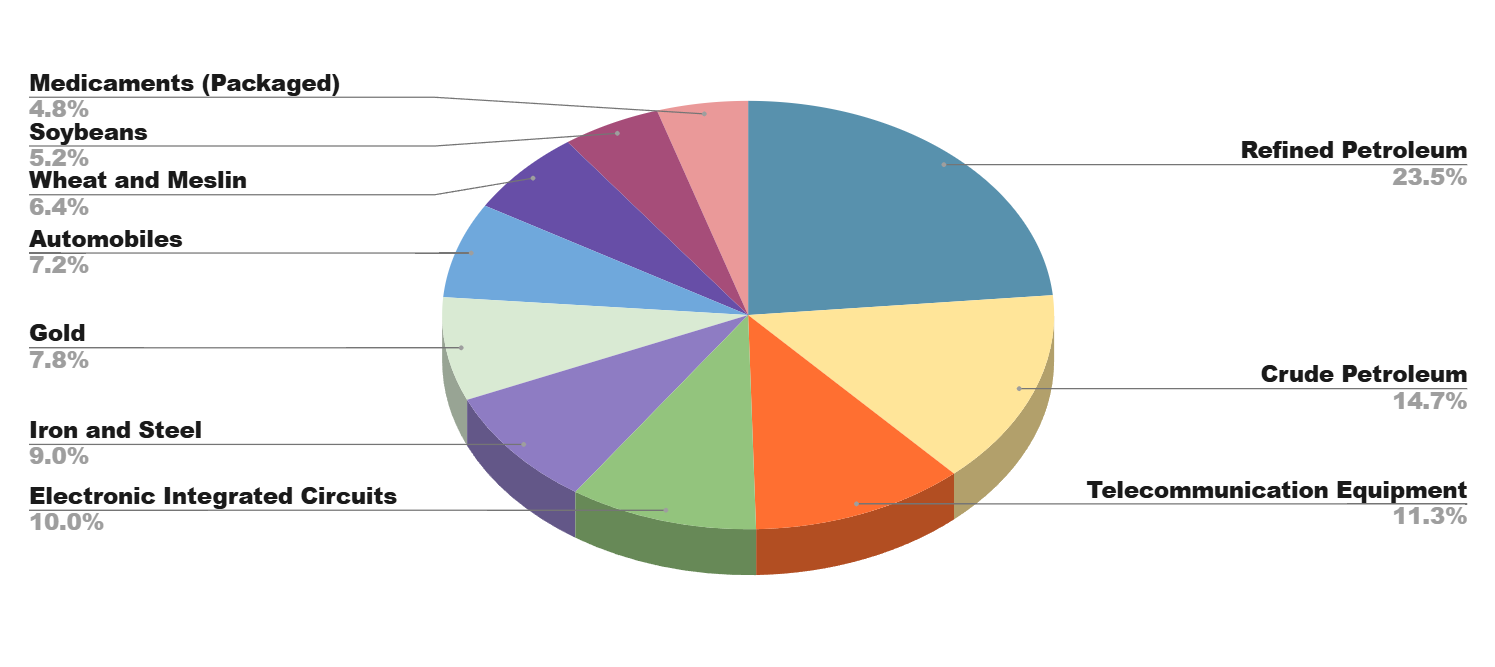
Indonesia Import Customs Trade Data Shows Top 10 Importing Products In 2023 – Analysis By Chapter

  • 18.9% (44 billion US dollar) HS CODE: 27 - Fuels and oils derived from mineral sources; bituminous substances; mineral waxes
  • 13.2% (31 billion USdollar) HS CODE: 84 - Parts of nuclear reactors, boilers, machinery, and mechanical appliances
  • 11.1% (26 billion USdollar) HS CODE: 85 - Parts and accessories of electrical machinery and equipment; sound recorders and reproducers; television image and sound recorders and reproducers; and parts and accessories thereof
  • 5.86% (13.9 billion USdollar) HS CODE: 72 - Iron and steel
  • 4.68% (11.1 billion USdollar) HS CODE: 39 –Articles made of Plastic
  • 4% (9.5 billion US$) HS CODE: 87 - Parts and accessories for vehicles other than railway or tramway rolling stock
  • 3.24% (7.71 billion USdollar) HS CODE: 29 - Organic chemicals
  • 1.92% (4.58 billion USdollar) HS CODE: 23 - Animal feed prepared from food industry residues and waste
  • 1.87% (4.45 billion USdollar) HS CODE: 10 - Cereals
  • 1.67% (3.98 billion USdollar) HS CODE: 73 - Steel or iron articles

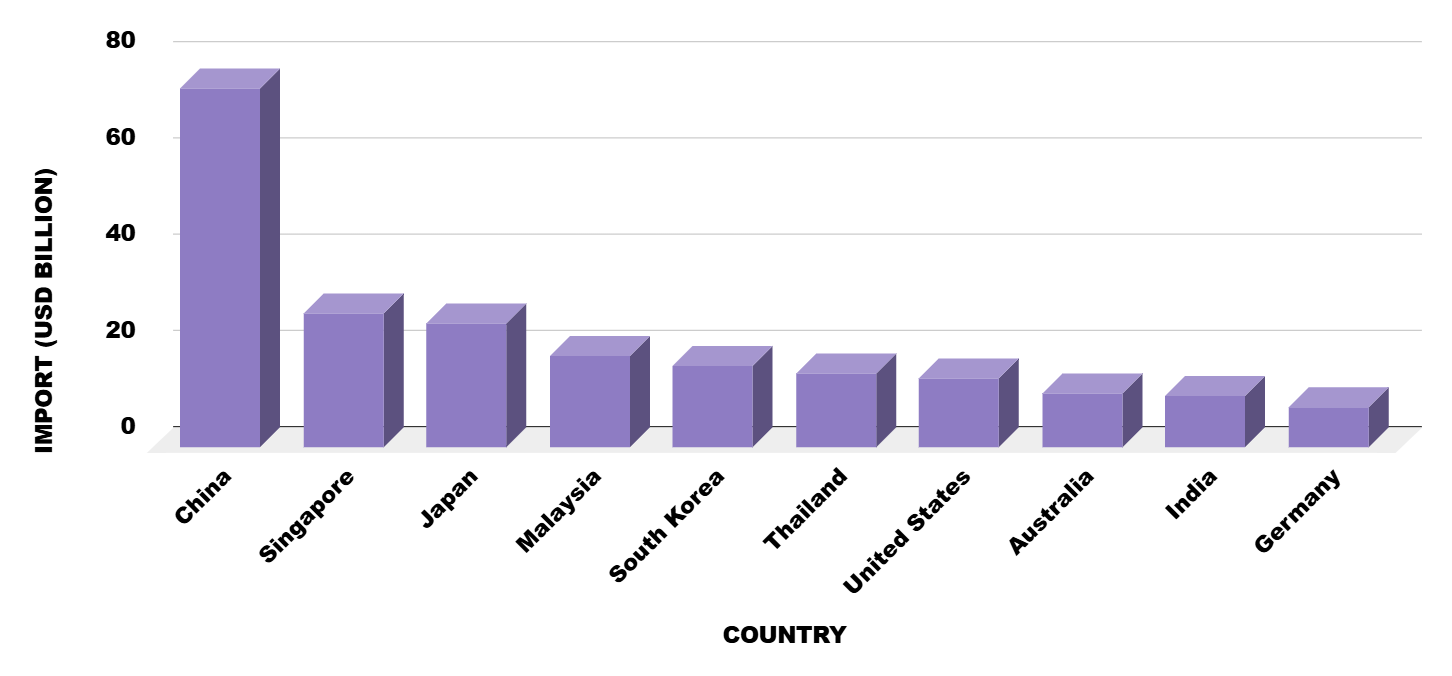
Indonesia Import Global Trade Data Shows Top 10
Trading Partners
of Indonesia

  • A share of 28% (67 billion US$), China dominates
  • A share of 8.17% (19.4 billion US$), Singapore dominates
  • A share of 7.23% (17.1 billion US$), Japan dominates
  • A share of 5.25% (12.4 billion US$), Malaysia dominates
  • A share of 4.93% (11.7 billion US$), Korean dominates
  • A share of 4.92% (11.6 billion US$), USA dominates
  • A share of 4.62% (10.9 billion US$), Thailand dominates
  • A share of 4.15% (9.86 billion US$), Australia dominates
  • A share of 3.92% (9.32 billion US$), India dominates
  • A share of 2.31% (5.49 billion US$), Saudi Arabia dominates

Indonesia Import Data Sample

HOW IMPORT GLOBALS INDONESIA IMPORT DATA IS BENEFICIAL FOR BUSINESS GROWTH

Every business needs accurate and detailed information about importing goods from one country to another. The reliable information on import-export trade activity can be a game changer for your business. It helps in efficient business planning and allows making informed decisions about the potential market of your product, where you can grow your business rapidly.

Import Globals provides detailed information on Indonesia Import Trade by subscribing to Indonesia Import Data you can get access to extensive detailed information on imports into the Indonesia market worldwide. Indonesia Trade Data includes all major columns such as Importers company, Exporters company, Product Description, HS Code, FOB, CIF, Net Weight, Quantity, ports, Origin Country, etc. This data gives you a well-rounded view of Indonesia's Import trade.

Indonesia Customs Data is collected from the most authenticated documents such as customs shipping bills, bills of entries, bills of lading, customs invoices, etc. It ensures the reliability of the data. Whether you are a new player in the market or an established company it is very necessary to get trustworthy information for business planning. Indonesia Trade Statistics provided by Import Globals gives valuable insight into Indonesia's market to make informed decisions about potential partners.

By using Indonesia Shipments Data, you can stay ahead of market trends and competitors. You can save plenty of time and money in researching potential clients and the market of your product. Not only time and money you can also increase the chance of successful business planning and dealing with the help of Indonesia Import Customs Data. It is easier for companies to approach clients and negotiate confidently by using Indonesia Trade Statistics.

FIND OUT OTHER ASIA COUNTRIES IMPORT EXPORT DATA

Ask for Indonesia Import Sample Data and Demo

TOP