Uganda Export Data

Uganda Export Data

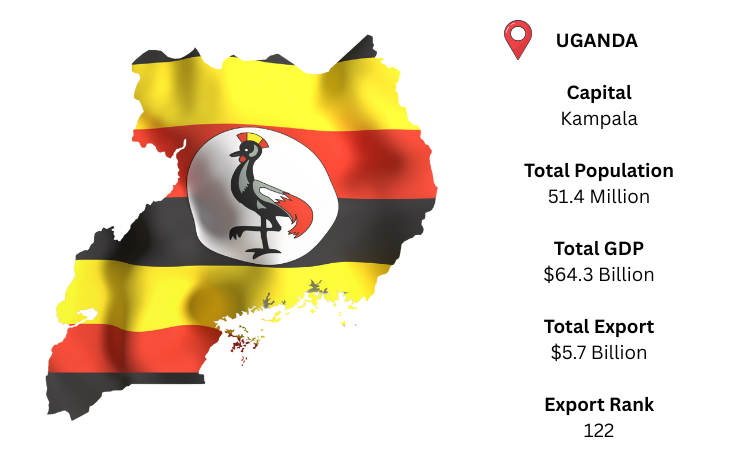
As per Uganda export data the economy of Uganda has great potential and appeared dignified for rapid economic growth and development.  Uganda is capable with significant natural resources, including ample fertile land, regular rainfall, and mineral deposits.

As per Uganda export trade data since 1990’s the economy of Uganda has been grown rapidly. During the period of 1990- 2015 real gross domestic product (GDP) grew at an average of 6.7% annually whereas real GDP per capita grew at 3.3% per annum during in the same period.

The moderate climate of Uganda is especially affable to the production of both livestock and crops.

Uganda export statistics data shows agricultural products supply a significant portion of Uganda’s foreign exchange earnings, with coffee alone, of which Uganda is Africa’s second largest producer after Ethiopia.

Agriculture accounts the large share of Uganda’s export earnings and its GDP, as well as it provides the main source of income for the vast majority of the adult population.

Uganda export custom data shows the value of merchandise exports from Uganda totalled $ 4.14 billion in 2020. As according to Uganda export trade statistics data the value of merchandise exports from Uganda amounted to $ in 2019.

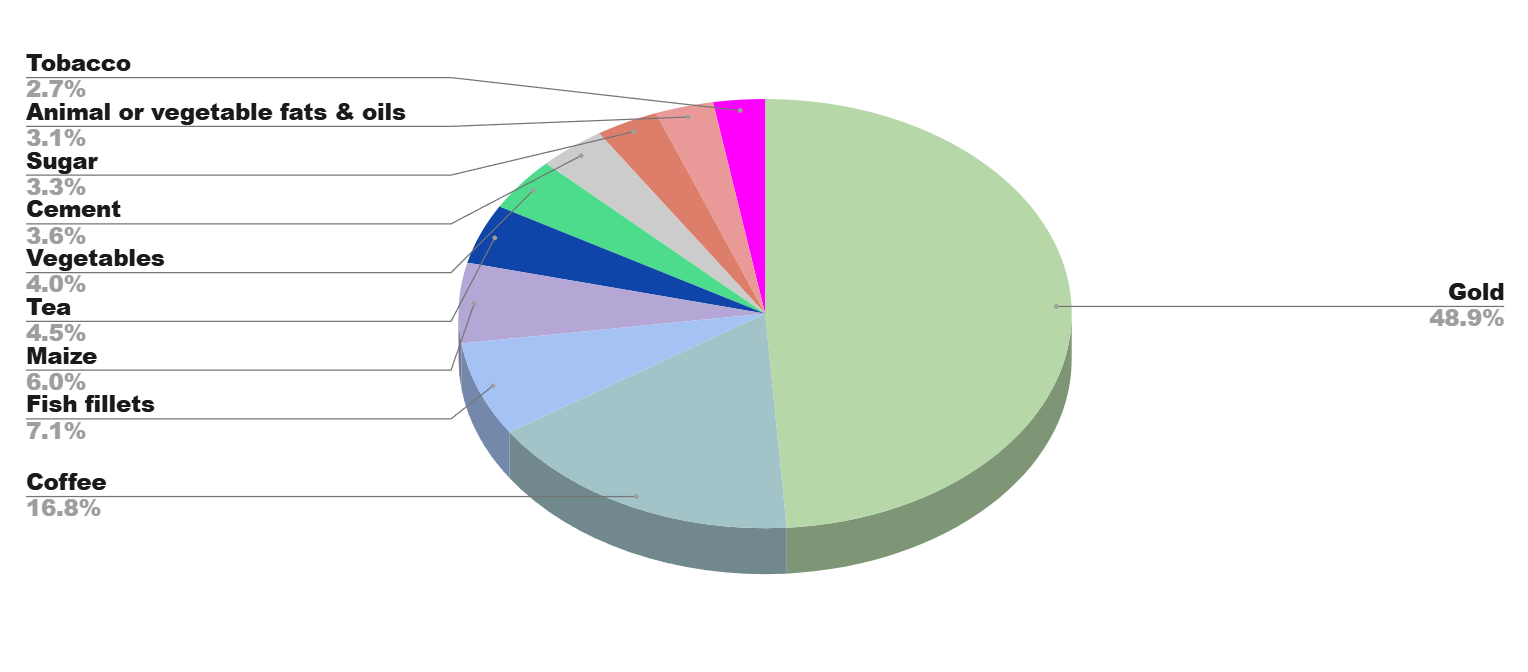
Uganda Export Customs Trade Data Shows Top 10 Exporting Products In 2020 – Analysis By Chapter

  • 43% for Chapter 71 – Natural or cultured pearls, precious or semi-precious stones, precious metals, metals clad with precious metal and articles thereof; imitation jewelry; coin value of 1.81 billion US$
  • 14.4% for Chapter 09 – Coffee, tea, matt and spices value of 600 million US$
  • 3.01% for Chapter 03 – Fish and crustaceans, mollusks and other aquatic invertebrates’ value of 124 million US$
  • 2.46% for Chapter 10 – Cereals value of 102 million US$
  • 2.39% for Chapter 18 – Cocoa and cocoa preparations value of 99 million US$
  • 2.37% for Chapter 27 – Mineral fuels, mineral oils and products of their distillation; bituminous substances; mineral waxes value of 98 million US$
  • 1.85% for Chapter 04 – Dairy produce; birds eggs; natural honey; edible products of animal origin, not elsewhere specified or included value of 76 million US$
  • 1.83% for Chapter 17 – Sugars and sugar confectionery value of 76 million US$
  • 1.82% for Chapter 25 – Salt; sulfur; earths and stone; plastering materials, lime and cement value of 75 million US$
  • 1.73% for Chapter 22 – Beverages, spirits and vinegar value of 71 million US$

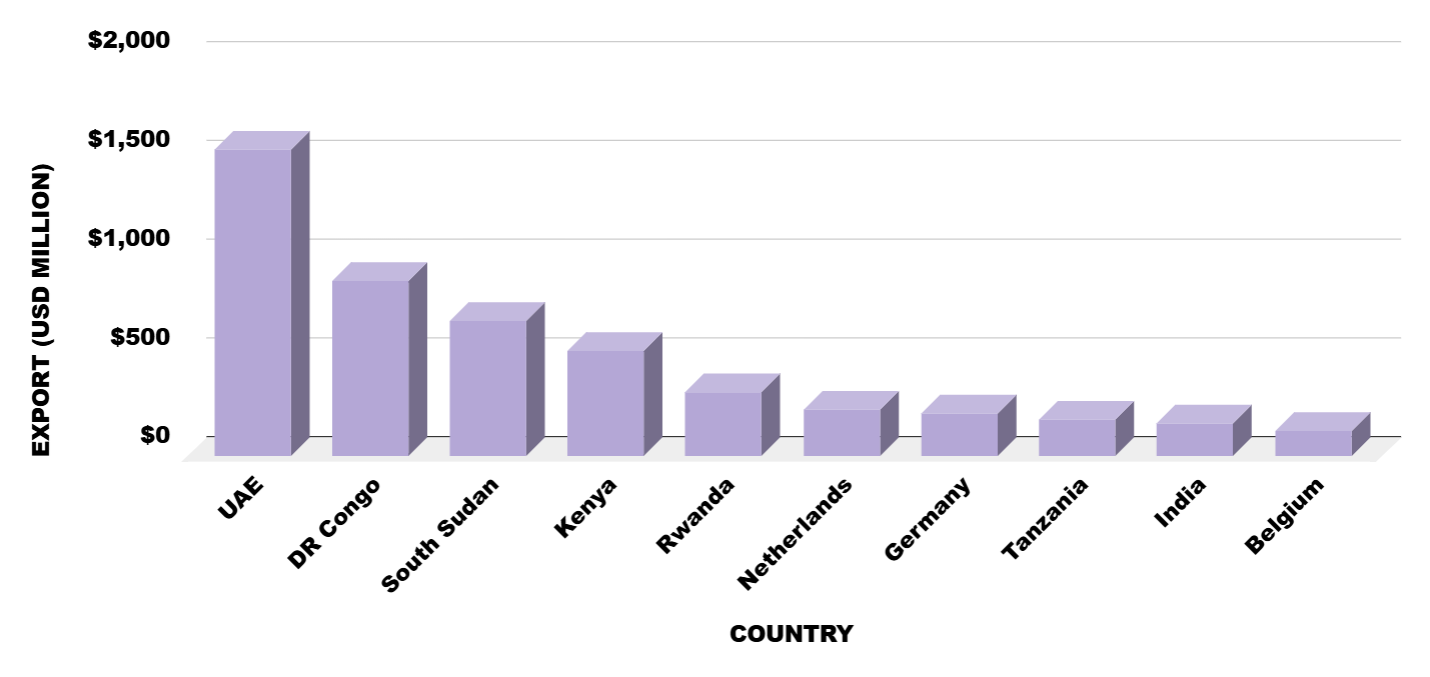
Uganda Export Global Trade Data Shows Top 10
Trading Partners
of Uganda

  • United Arab Emirates with a share of 44% (1.84 billion US$)
  • Kenya with a share of 11.2% (465 million US$)
  • South Sudan with a share of 8.61% (357 million US$)
  • Dem. Rep. Congo with a share of 6.43% (267 million US$)
  • Italy with a share of 3.32% (138 million US$)
  • Tanzania with a share of 2.29% (95 million US$)
  • Germany with a share of 2.26% (93 million US$)
  • Sudan with a share of 2.16% (89 million US$)
  • Netherlands with a share of 1.88% (78 million US$)
  • Belgium with a share of 1.74% (72 million US$)

Uganda Export Data Sample

We Import Globals provides you a platform to reach direct suppliers & buyers of your product. You can check by using our Uganda export trade statistics data out all trade activities between Uganda and other countries. We have recorded more than 80 million of shipment records from over 8 million businesses in 18 countries.

We have established top leading name in the market by serving more than 5000 clients and they are highly satisfied with our services.

Use right way to grow your business by using Import Globals Uganda custom data

Our Expert team will be happy to provide you solution on your business through Global trade database.

FIND OUT OTHER AFRICA COUNTRIES IMPORT EXPORT DATA

Ask for Uganda Export Sample Data and Demo

TOP