Guatemala Import Data

Guatemala Import Data

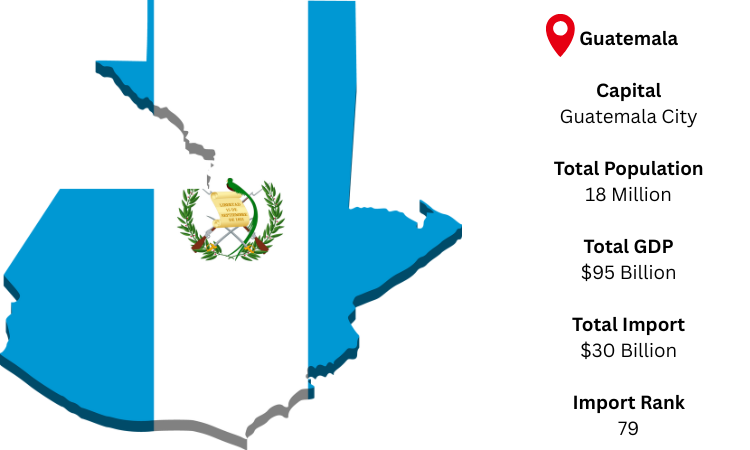
As per Guatemala import data Guatemala is considered as a developing economy and it is highly dependent on its traditional agriculture crops such as Coffee, Sugar and Bananas. As per Guatemala import trade data the traditional export of goods represents a large share to the market. The economy of Guatemala is dominated by the private sector which generates GDP of about 85% as per recorded figures.

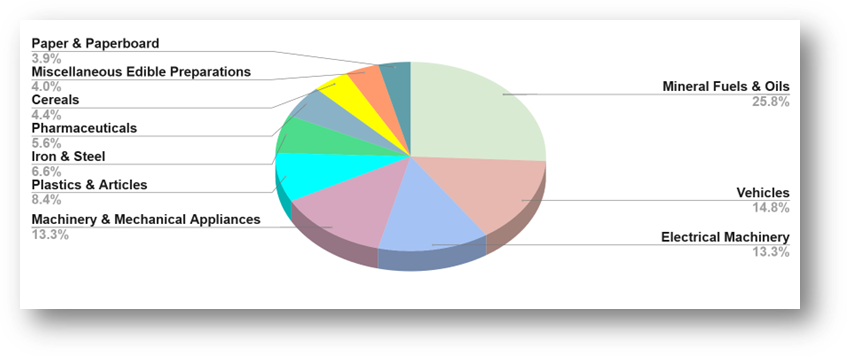
As per Guatemala import customs data shows top Importing products by  Guatemala are Mineral fuels, mineral oils and products of their distillation, Second top Importing products are Electric Machinery and Equipment’s followed by Machinery and Mechanical appliances are Third top importing products.

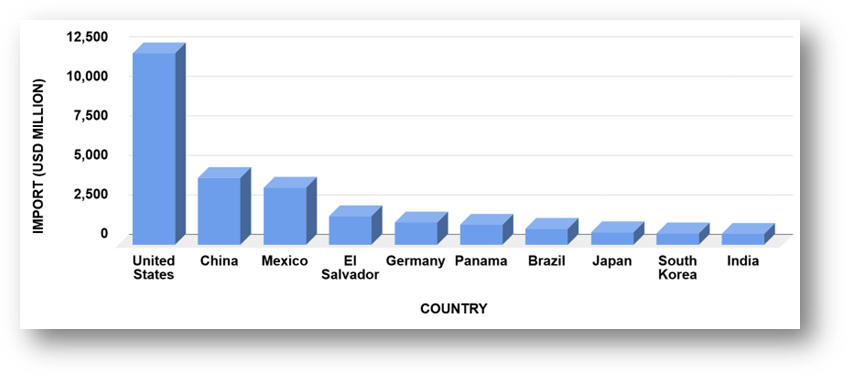
According to Guatemala import statistics data United States is top leading trading partner of Guatemala with a share of 34%. Second top trading partner is China with a share of 12.3% and Mexico with a share of 8.73 is third top trading partner of Guatemala.

As according to Guatemala import trade statistics data the value of merchandise imports to Guatemala totalled $ 18.1 billion in 2020. The value of merchandise imports to Guatemala was equal to $19.8 billion in 2019.

Guatemala Import Customs Trade Data Shows Top 10 Importing Products In 2020 – Analysis By Chapter

  • 11.8% for Chapter 27 – Mineral fuels, mineral oils and products of their distillation; bituminous substances; mineral waxes value of 2.15 billion US$
  • 8.5% for Chapter 85 – Electrical machinery and equipment and parts thereof; sound recorders and reproducers, television image and sound recorders and reproducers, and parts and accessories of such articles value of 1.54 billion US$
  • 7.78% for Chapter 84 – Nuclear reactors, boilers, machinery and mechanical appliances; parts thereof value of 1.41 billion US$
  • 6.8% for Chapter 87 – Vehicles other than railway or tramway rolling stock, and parts and accessories thereof value of 1.23 billion US$
  • 5.94% for Chapter 39 – Plastics and articles thereof value of 1.08 billion US$
  • 3.78% for Chapter 48 – Paper and paperboard; articles of paper pulp, of paper or of paperboard value of 689 million US$
  • 3.77% for Chapter 30 – Pharmaceutical productsvalue of 687 million US$
  • 3.7% for Chapter 72 – Iron and steel value of 674 million US$
  • 3.01% for Chapter 10 – Cereals value of 549 million US$
  • 2.37% for Chapter 21 – Miscellaneous edible preparations value of 431 million US$

Guatemala Import Global Trade Data Shows Top 10
Trading Partners
of Guatemala

  • USA with a share of 34% (6.29 billion US$)
  • China with a share of 12.3% (2.25 billion US$)
  • Mexico with a share of 11.6% (2.12 billion US$)
  • El Salvador with a share of 5.35% (974 million US$)
  • Costa Rica with a share of 3.78% (688 million US$)
  • Panama with a share of 3.39% (618 million US$)
  • Honduras with a share of 2.7% (492 million US$)
  • Colombia with a share of 2.24% (408 million US$)
  • India with a share of 1.65% (300 million US$)
  • Brazil with a share of 1.61% (293 million US$)

Guatemala Import Data Sample

We Import Globals provides you a platform to reach direct suppliers & buyers of your product. You can check by using our Guatemala import trade statistics data out all trade activities between Guatemala and other countries. We have recorded more than 80 million of shipment records from over 8 million businesses in 18 countries.

We have established top leading name in the market by serving more than 5000 clients and they are highly satisfied with our services.

Use right way to grow your business by using Import Globals Guatemala customs data

Our Expert team will be happy to provide you solution on your business through Global trade data.

FIND OUT OTHER NORTH AMERICA COUNTRIES IMPORT EXPORT DATA

Ask for Guatemala Import Sample Data and Demo

TOP