USA Import Data

USA Import Data

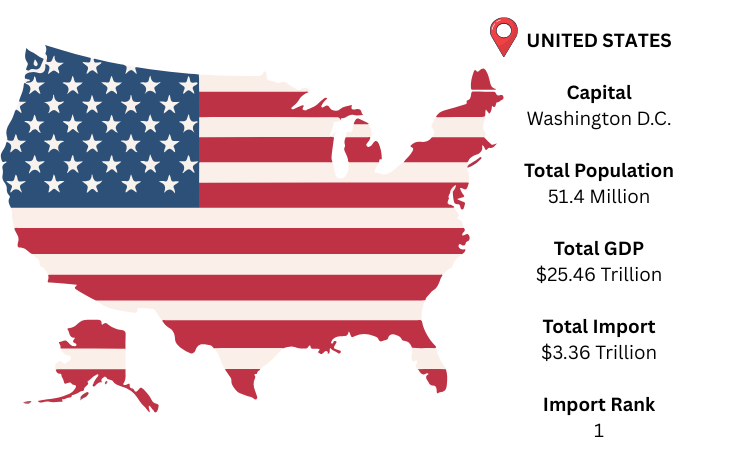
The United States is one of the strongest players in the global market in both Import and Export trades. In 2023, According to USA Import Data, the total value of USA's imports and exports by 2023 is reached to $6 trillion. This data shows an increase from the last years trade due to country strong economic growth. USA have a total population of over 341 million people in 2023. The GDP of the United States was recorded $24 trillion in 2023. USA's GDP is expected to continue its upward trend in 2024.

The USA has successfully retained its position in one of the top three importing countries. Its strong economic growth and high demand of consumers goods enables it as a model market for importing goods from all over the world. Moreover, a continuous effort to improve trade relations with other countries through free trade agreements and negotiations on tariffs, the USA will continue to maintain its strong import rank in the years to come.

China dominates as a leading supplier of United States in 2023. China export nearly 20% of wide range of products to US. It includes electronics products, machinery equipment’s and parts , furniture, clothing, textiles and more.   Mexico and Canada due to their geographical proximity have long been important trading partners for the US as well as their participation in NAFTA (North American Free Trade Agreement). Together (Mexico and Canada) they account for approx.19% of total US imports. While both countries mainly supply automobiles and petroleum products to the US market currently, there may be more opportunities in the coming year 2024 for other industries such as agriculture or technology to grow in this partnership.

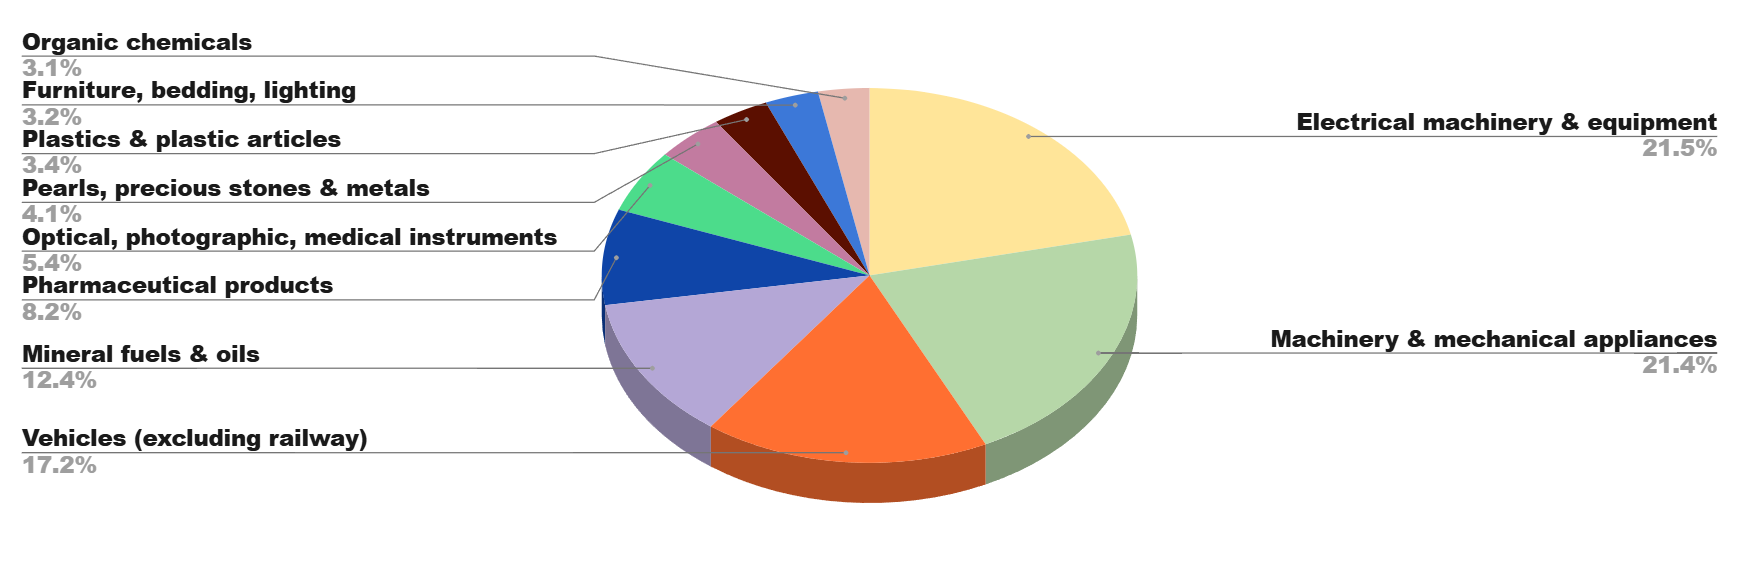
USA Import Customs Trade Data Shows Top 10 Importing Products In 2023 – Analysis By Chapter

  • 14.6% (463 billion US dollars) : HS CODE 85 - Electrical machinery and equipment; sound recorders and reproducers; television image and sound recorders and reproducers; and parts and accessories for such items.
  • 14.4% (459 billion US dollars): HS CODE 84 - Nuclear reactors, boilers, machinery and mechanical appliances; parts thereof
  • 12% (381 billion US dollars): HS CODE 87 - Vehicles other than railway or tramway rolling stock, and their parts and accessories
  • 8.41% (266 billion US$) of HS CODE 27 - Mineral fuels, mineral oils, and products of their distillation; bituminous substances; mineral waxes
  • 5.61% (177 billion US dollars)HS CODE 30 - Pharmaceutical products
  • 3.81% (124 billion US dollars) of HS CODE 99 - Unspecified commodities
  • 3.7% (118 billion US$): HS CODE 90 - Optical, photographic, cinematographic, measuring, checking, precision, medical or surgical instruments and apparatus; parts and accessories
  • 2.69% (85 billion US dollars): HS CODE 71 - Natural or cultured pearls, precious and semi-precious stones, precious metals, metals clad with precious metals, and articles thereof; imitation jewelry; coins
  • 2.28% (72 billion US dollars): HS CODE 39 - Plastics and articles made from them
  • 2.17 percent (69 billion US dollars): HS CODE 94 - Furniture, bedding, mattresses, mattress supports, cushions, and similar stuffed furnishings; lamps and lighting fittings, n.e.s.; illuminated signs, illuminated name-plates, and the like; prefabricated b

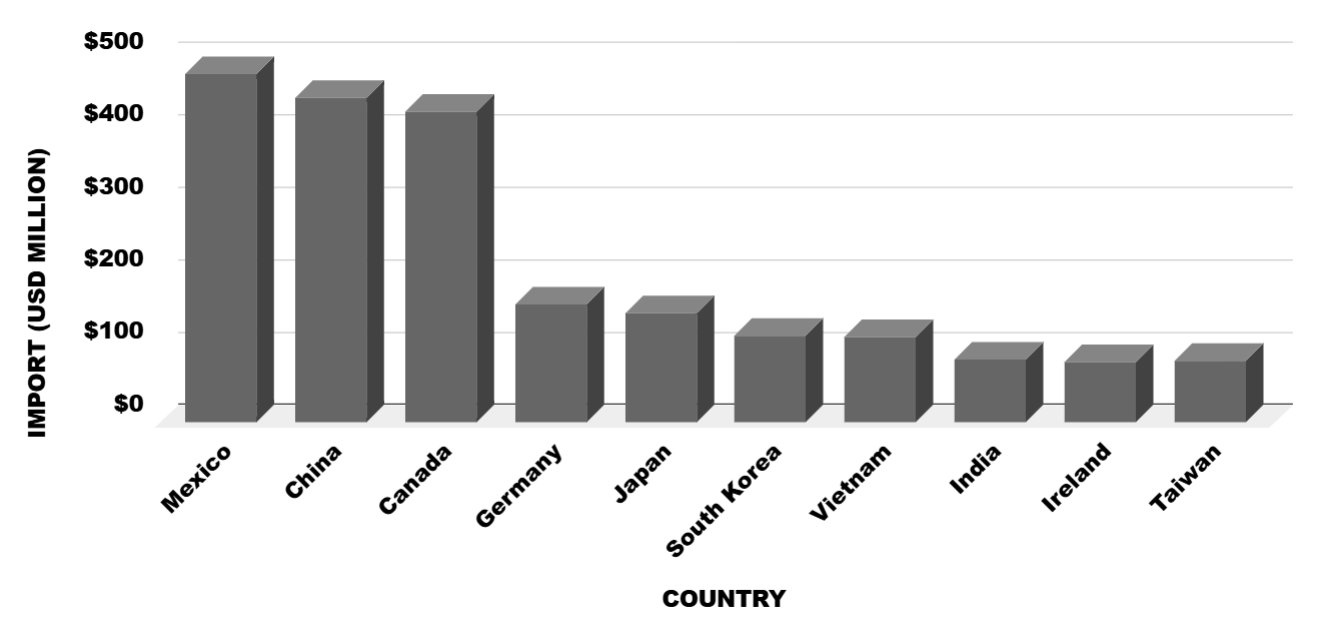
USA Import Global Trade Data Shows Top 10
Trading Partners
of USA

  • Mexico dominateswith a share of 15.1% (480 billion US dollars)
  • China dominateswith a share of 14.1% (448 billion US dollars)
  • Canada dominates with a share of 13.5% (429 billion US dollars)
  • Germany dominates with a share of is 5.14% (162 billion US dollars)
  • Japan dominates with a share of 4.78% (151 billion US dollars)
  • Koreadominates with a share of 3.77% (119 billion US dollars)
  • Vietnam dominates with a share of 3.75% (118 billion US dollars)
  • Other Asia, dominates with a share of 2.83% (89 billion US dollars) was accounted for by
  • India dominates with a share 2.75% (87 billion US dollars)
  • Ireland dominates with a share of 2.61% (82 billion US dollars)

USA Import Data Sample

HOW USA IMPORT DATA IS BENEFICIAL TO GROW YOUR BUSINESS GLOBALLY

USA Import Data provided by Import Globals provides you the detailed and accurate data for all import and export transactions that have been transited globally. It is the most crucial information for all businesses to grow at international scale and make an informative decision with the help of USA Import Trade Data.

USA Import Custom data includes all essential information such as bill of lading details, consignee name and address, shipper name and address, destination country, origin country, HS code of products, and product description. With the help of available information companies can better understand the market of product, importing, selling strategies, pricing strategies which ultimately convert it into sales growth and customer satisfaction.

USA Import Trade Data included of HS Codes. These codes are important to classify goods for customs purposes. The HS Code of products basically provides a detailed breakdown of products categories of what exactly is being imported into the country.

By utilizing USA Import Shipment Data provided by Import Globals, you can gain valuable insights into market trends, navigate unfamiliar territories of your product, understand competitor strategies, knowing the consumer preferences. This information is crucial for making informed decisions that will drive success in the global marketplace.

FIND OUT OTHER NORTH AMERICA COUNTRIES IMPORT EXPORT DATA

Ask for USA Import Sample Data and Demo

TOP