Uganda Import Data

Uganda Import Data

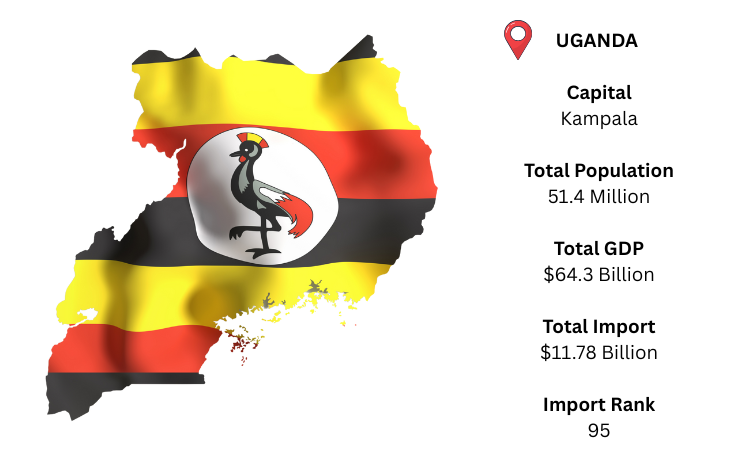
Uganda is a landlocked East African country bordered by Kenya, Tanzania, Rwanda, South Sudan, and the Democratic Republic of the Congo. Its capital city is Kampala. As per Uganda import data, the country’s GDP stood at approximately USD 64.3 billion in 2023. Uganda imported goods worth around USD 11.78 billion in 2023, driven primarily by rising demand for fuel, machinery, vehicles, and pharmaceutical products.

95

Uganda ranked 95th globally in total imports, reflecting a steadily growing trade economy in the East African region.

0.6%

Uganda contributed approximately 0.06% to total global imports, with major import flows supporting its energy, construction, health, and manufacturing sectors.

China

China was Uganda’s top import partner in 2023, accounting for nearly 20% of all imports, supplying heavy machinery, electrical equipment, and industrial materials.

Mineral fuels & oils

Uganda’s leading import category was mineral fuels & oils, which met the country’s energy and transportation requirements.


Top 10 Import Products of Uganda

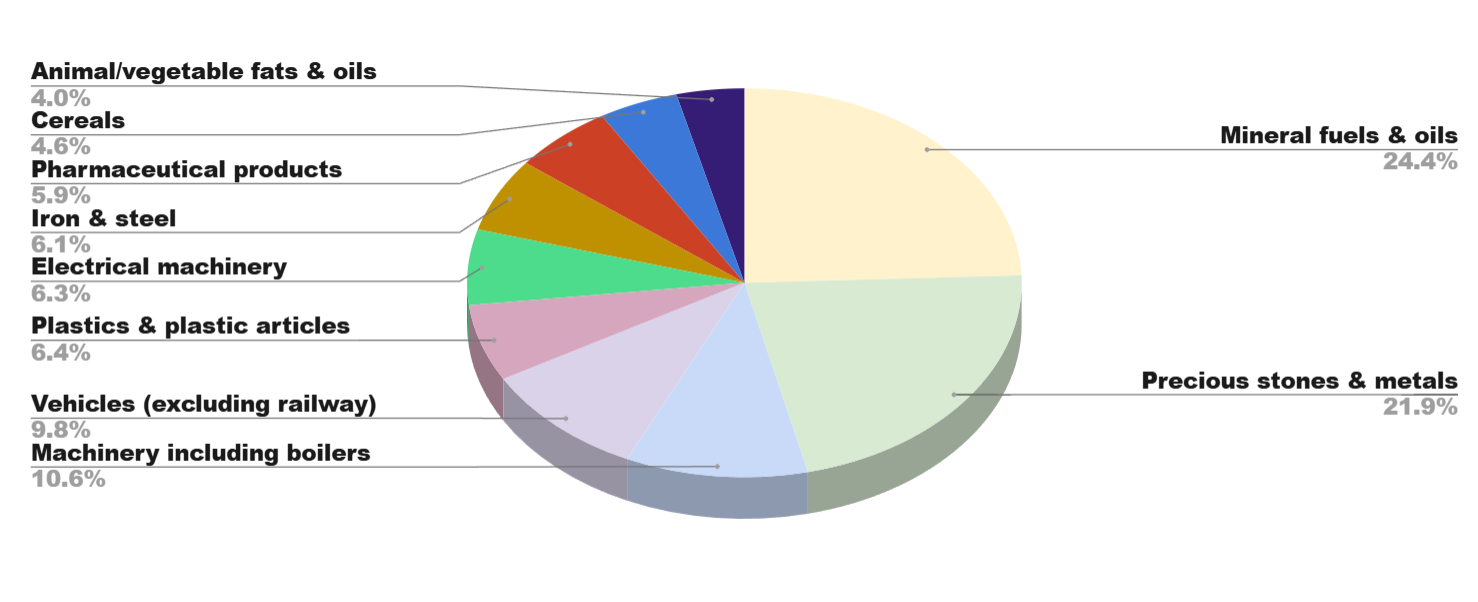
As per Uganda customs import data, mineral fuels and oils accounted for 17.9% of Uganda's imports, followed by precious metals (16.1%), equipment (7.8%), and automobiles (7.2%), according to customs data. Cereals, plastics, medications, and electrical products were among the other major imports.

  • Mineral fuels & oils (HS Code 27) – 17.9% – USD 2.11 billion
  • Precious stones & metals (HS Code 71) – 16.1% – USD 1.90 billion
  • Machinery including boilers (HS Code 84) – 7.8% – USD 914.7 million
  • Vehicles (HS Code 87) – 7.2% – USD 844.1 million
  • Plastics & plastic articles (HS Code 39) – 4.7% – USD 558.4 million
  • Electrical machinery (HS Code 85) – 4.6% – USD 541.1 million
  • Iron & steel (HS Code 72) – 4.5% – USD 527.1 million
  • Pharmaceutical products (HS Code 30) – 4.3% – USD 507.1 million
  • Cereals (HS Code 10) – 3.4% – USD 402.9 million
  • Animal/vegetable fats & oils (HS Code 15) – 2.9% – USD 339.8 million
Product Image
Product Image

Top 10 Import Trading Partners of Uganda

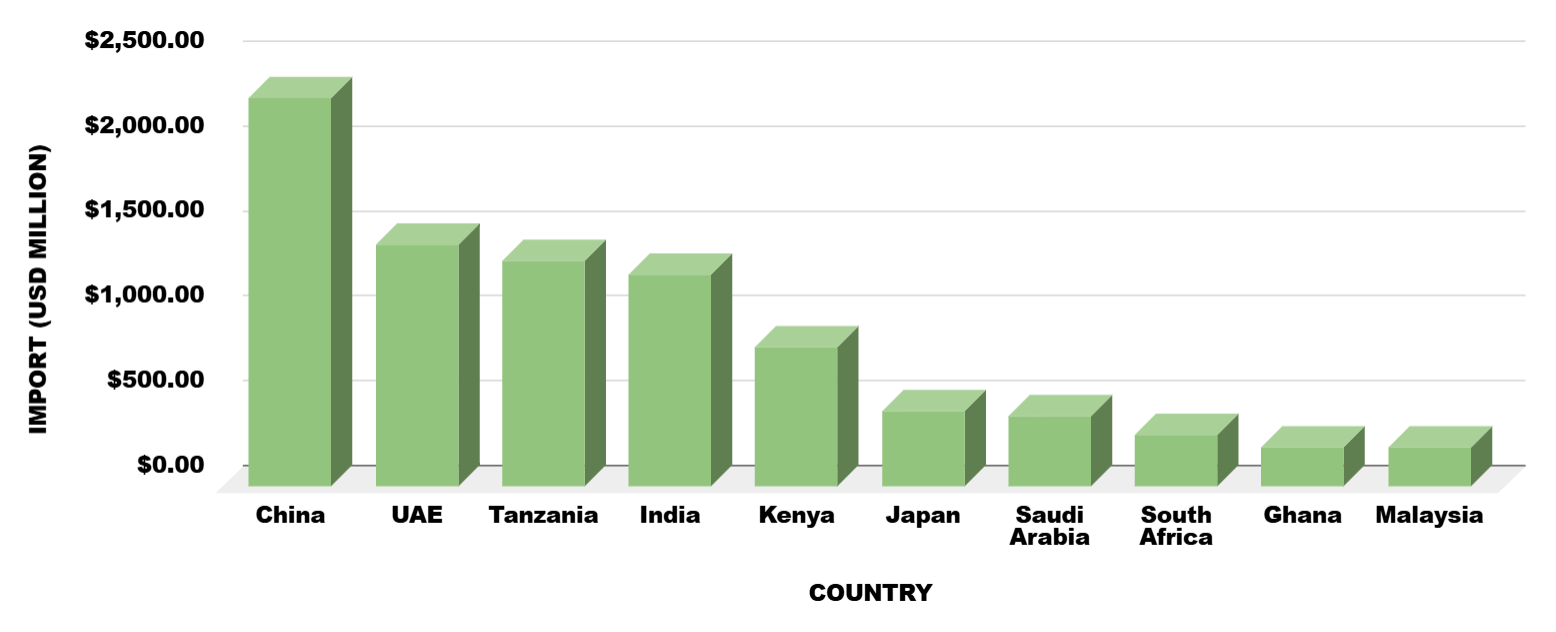
As per Uganda shipments data, the main sources of Uganda's imports, according to customs import statistics, were Asia, the Middle East, and regional partners. According to Uganda customs data, China topped the list, followed by Tanzania, India, and the United Arab Emirates. Together, these top ten nations supplied more than 80% of Uganda's imports.

  • China – 19.4% – USD 2.29 billion
  • United Arab Emirates (UAE) – 12.1% – USD 1.43 billion
  • Tanzania – 11.3% – USD 1.33 billion
  • India – 10.6% – USD 1.25 billion
  • Kenya – 7.0% – USD 824 million
  • Japan – 3.8% – USD 449 million
  • Saudi Arabia – 3.5% – USD 416 million
  • South Africa – 2.6% – USD 306 million
  • Ghana – 2.0% – USD 234 million
  • Malaysia – 2.0% – USD 233 million

What Details Contain In Uganda Import Data?

All shipments by land, air, and sea are covered by the 100% comprehensive customs detailed data for Uganda. Gain access to a sizable dataset with crucial trade attributes that enable in-depth analysis at every level. Businesses, analysts, and politicians may monitor all facets of import operations with this comprehensive data, from product descriptions and shipment sources to pricing and modes of transportation. Users may pinpoint market opportunities, analyze supplier performance, and spot sourcing patterns with full insight into every transaction. This information is a vital starting point for strategic decision-making, whether you're keeping an eye on rivals or preparing to enter the Uganda market. The data contains all required fields:

  • Importer Name
  • Importer Address
  • Exporter Name
  • Exporter Address
  • Shipping Bill Number
  • Shipping Bill Date
  • Declaration Number
  • HS Code
  • Product Description
  • FOB Value
  • CIF Value
  • Manufacturing Country
  • Destination Country
  • Net Weight
  • Gross Weight
  • Quantity
  • Unit
  • Currency & Incoterms
  • Mode of Transportation
  • Port of Loading
  • Port of Unloading
  • Email
  • Contact

Benefits of Uganda Import data in your business

  • Use this information to investigate the global market: Learn important information about the Uganda import market and find international vendors.
  • Business Decision: Make well-informed choices supported by correct, up-to-date facts.
  • Reduce Risk: To assess possible hazards, examine shipping data from the past and current periods.
  • Extremely Accurate Data: Obtained from verified customs sources, guaranteeing dependability and validity.
  • Monitor Competitor Business: Determine the sourcing and supply networks of rival companies.
  • Stay Ahead in Pricing Strategy: Use accurate FOB/CIF data to maintain competitive pricing.

YOU MAY BE INTERESTED IN OTHER AFRICA COUNTRIES IMPORT EXPORT DATA

Frequently Asked Questions

According to Uganda import data, mineral fuels & oils (HS Code 27) were the most demanded in 2023, valued at USD 2.11 billion. Other top imports include precious metals, machinery, vehicles, and pharmaceutical products.
As per Uganda customs data, the top imported products in 2023 were mineral fuels & oils (17.9%), followed by precious metals (16.1%), machinery (7.8%), and vehicles (7.2%). These categories fulfill energy, transport, and infrastructure needs.

Uganda trade data suggests a growing push in the healthcare, infrastructure, and industrial sectors. Increasing imports of machinery, pharmaceuticals, and electrical equipment indicate development efforts in those key areas.

While Uganda is primarily an importer, regional countries like South Sudan and Rwanda depend on Uganda for processed goods, cement, and foodstuffs. Trade data reveals Uganda as a transit and re-export hub for East Africa.

You can explore full Uganda import export data through trusted sources like Import Globals, a verified data provider. They offer detailed customs records including transaction-level insights for analyzing Uganda’s trade flow.

Ask for Uganda Import Sample Data and Demo

Whatsapp
TOP