Uruguay Export Data

Uruguay Export Data

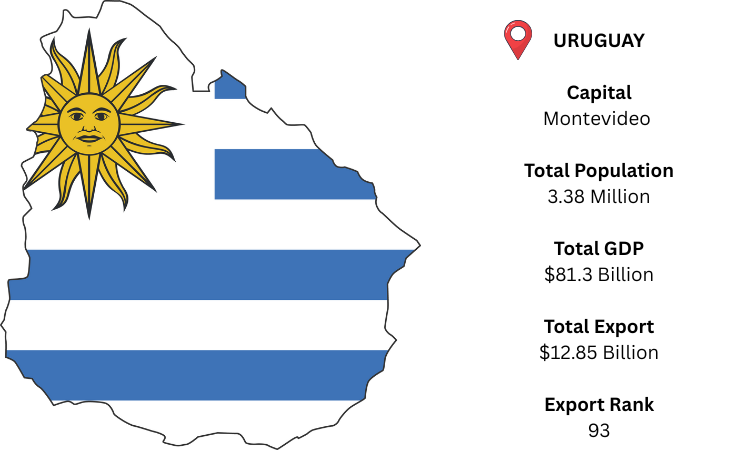
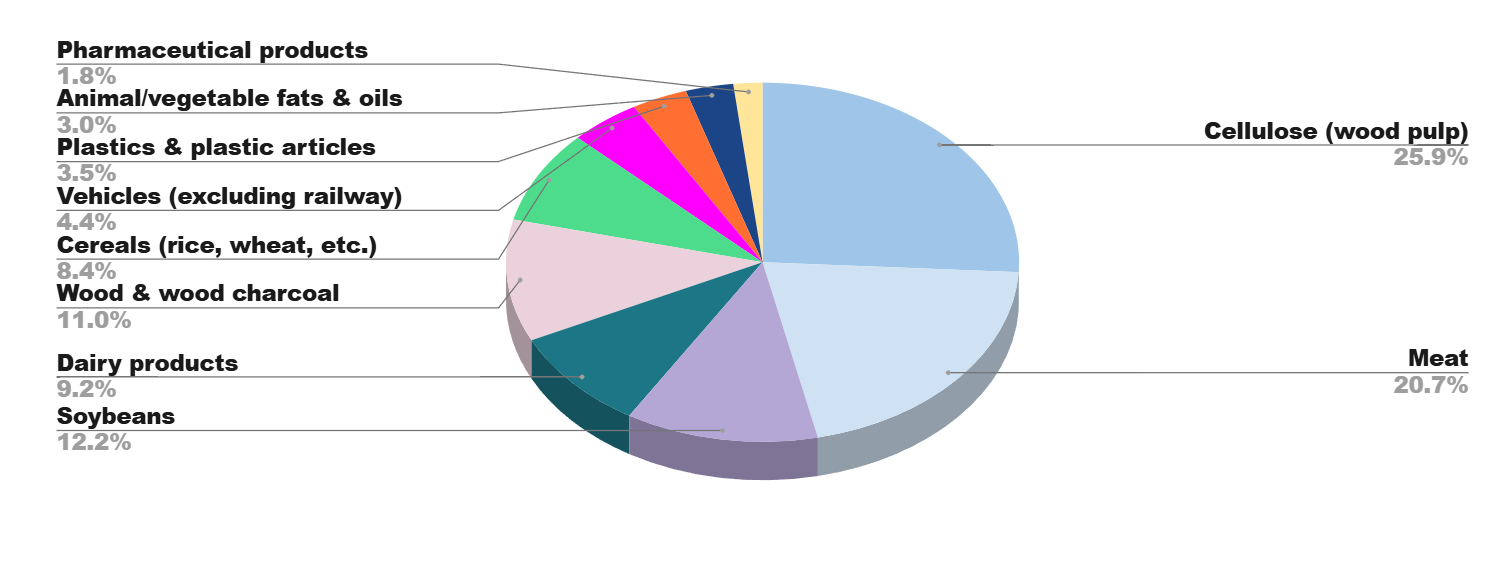
The capital of Uruguay, a small South American country bounded by Argentina and Brazil, is Montevideo. Uruguay generated a GDP of about USD 81.3 billion in 2024, according to Uruguay export data. Uruguay exported around USD 12.85 billion worth of commodities that year, with the meat, wood pulp, and agricultural products sectors accounting for the majority of its exports.

93

Uruguay ranked 93rd globally in total exports, reflecting its role as a niche but high-quality commodity exporter.

0.05%

Uruguay accounted for about 0.05% of global exports, with its economy relying heavily on cellulose, beef, soybeans, and dairy shipments.

China

China emerged as Uruguay’s leading export destination, importing large volumes of beef, soybeans, and cellulose.

Cellulose (Wood pulp)

Uruguay’s top exported commodity was cellulose, primarily used in paper manufacturing, with a value exceeding USD 2.5 billion.


Top 10 Export Products of Uruguay

Uruguay trade data shows that wood pulp, or cellulose, made up almost 20% of total exports, with meat(16%), soybeans (9%), and dairy products (7%) following closely behind. Wood, grains, polymers, and pharmaceuticals were other significant export areas.

  • Cellulose (HS Code 4703) – 19.8% – USD 2.55 billion
  • Meat (HS Code 0201/0202) – 15.8% – USD 2.03 billion
  • Soybeans (HS Code 1201) – 9.3% – USD 1.20 billion
  • Dairy products (HS Code 04) – 7.0% – USD 894 million
  • Wood & wood charcoal (HS Code 44) – 8.4% – USD 1.08 billion
  • Cereals (rice, etc.) (HS Code 10) – 6.4% – USD 819 million
  • Vehicles (HS Code 87) – 3.4% – USD 438 million
  • Plastics & plastic articles (HS Code 39) – 2.7% – USD 353 million
  • Animal/vegetable fats & oils (HS Code 15) – 2.3% – USD 293 million
  • Pharmaceutical products (HS Code 30) – 1.4% – USD 185 million
Product Image
Product Image

Top 10 Export Trading Partners of Uruguay

As per Uruguay trade statistics, China was Uruguay's biggest export destination in 2024, followed by the US, Brazil, and the EU, according to export data. Moreover, over 75% of the country's entire export value came from these top partners combined.

  • China – 24.0% – USD 3.08 billion
  • Brazil – 18.0% – USD 2.31 billion
  • European Union (mainly Netherlands, Germany, Italy) – 14.0% – USD 1.80 billion
  • United States – 9.0% – USD 1.16 billion
  • Argentina – 5.0% – USD 642 million
  • Mexico – 3.5% – USD 450 million
  • Chile – 3.1% – USD 398 million
  • India – 2.8% – USD 359 million
  • Paraguay – 2.6% – USD 335 million
  • Russia – 2.2% – USD 282 million

What Details Contain In Uruguay Export Data?

All shipments by land, air, and sea are covered by the 100% comprehensive customs detailed data for Uruguay. Gain access to a sizable dataset with crucial trade attributes that enable in-depth analysis at every level. Businesses, analysts, and politicians may monitor all facets of export operations with this comprehensive data, from product descriptions and shipment sources to pricing and modes of transportation. Users may pinpoint market opportunities, analyze supplier performance, and spot sourcing patterns with full insight into every transaction. This information is a vital starting point for strategic decision-making, whether you're keeping an eye on rivals or preparing to enter the Uruguay market. The data contains all required fields:

  • Exporter Name
  • Exporter Address
  • Importer Name
  • Importer Address
  • Shipping Bill Number
  • Shipping Bill Date
  • Declaration Number
  • HS Code
  • Product Description
  • FOB Value
  • CIF Value
  • Manufacturing Country
  • Destination Country
  • Net Weight
  • Gross Weight
  • Quantity
  • Unit
  • Currency & Incoterms
  • Mode of Transportation
  • Port of Loading
  • Port of Unloading
  • Email
  • Contact

Benefits of Uruguay Export data in your business

  • Use this information to investigate the global market: Learn important information about the Uruguay export market and find international vendors.
  • Business Decision: Make well-informed choices supported by correct, up-to-date facts.
  • Reduce Risk: To assess possible hazards, examine shipping data from the past and current periods.
  • Extremely Accurate Data: Obtained from verified customs sources, guaranteeing dependability and validity.
  • Monitor Competitor Business: Determine the sourcing and supply networks of rival companies.
  • Stay Ahead in Pricing Strategy: Use accurate FOB/CIF data to maintain competitive pricing.

YOU MAY BE INTERESTED IN OTHER SOUTH AMERICA COUNTRIES IMPORT EXPORT DATA

Frequently Asked Questions

From an export perspective, cellulose, meat, and soybeans are in high demand globally. These sectors dominate Uruguay export data, reflecting global reliance on Uruguay’s high-quality agricultural and forest products.

Uruguay’s top industrial contributors include UPM and Montes del Plata in cellulose, and large-scale meat processors. As shown in Uruguay trade data, these brands fuel both GDP and export earnings.

Brazil, a close neighbor and major trade partner, is a key regional manufacturing hub. Many raw materials from Uruguay are processed there. Uruguay customs data confirms strong bilateral trade between the two countries.

Uruguay is strengthening ties with China and the EU, its top markets. Recent trade talks and Uruguay export import data trends indicate growing focus on long-term bilateral agreements and tariff reduction.

Uruguay, as part of MERCOSUR, is finalizing deals with the European Union and Singapore. These pacts aim to reduce export tariffs, especially on agricultural and cellulose products, boosting market competitiveness.

Ask for Uruguay Export Sample Data and Demo

Whatsapp
TOP