
Allies at the Border: U.S.-Canada-Mexico Trade Friction Reshapes North American Supply Chains
- Oct 07, 2026
- 130 Views
Allies at the Border: U.S.-Canada-Mexico Trade Friction Reshapes North American Supply Chains
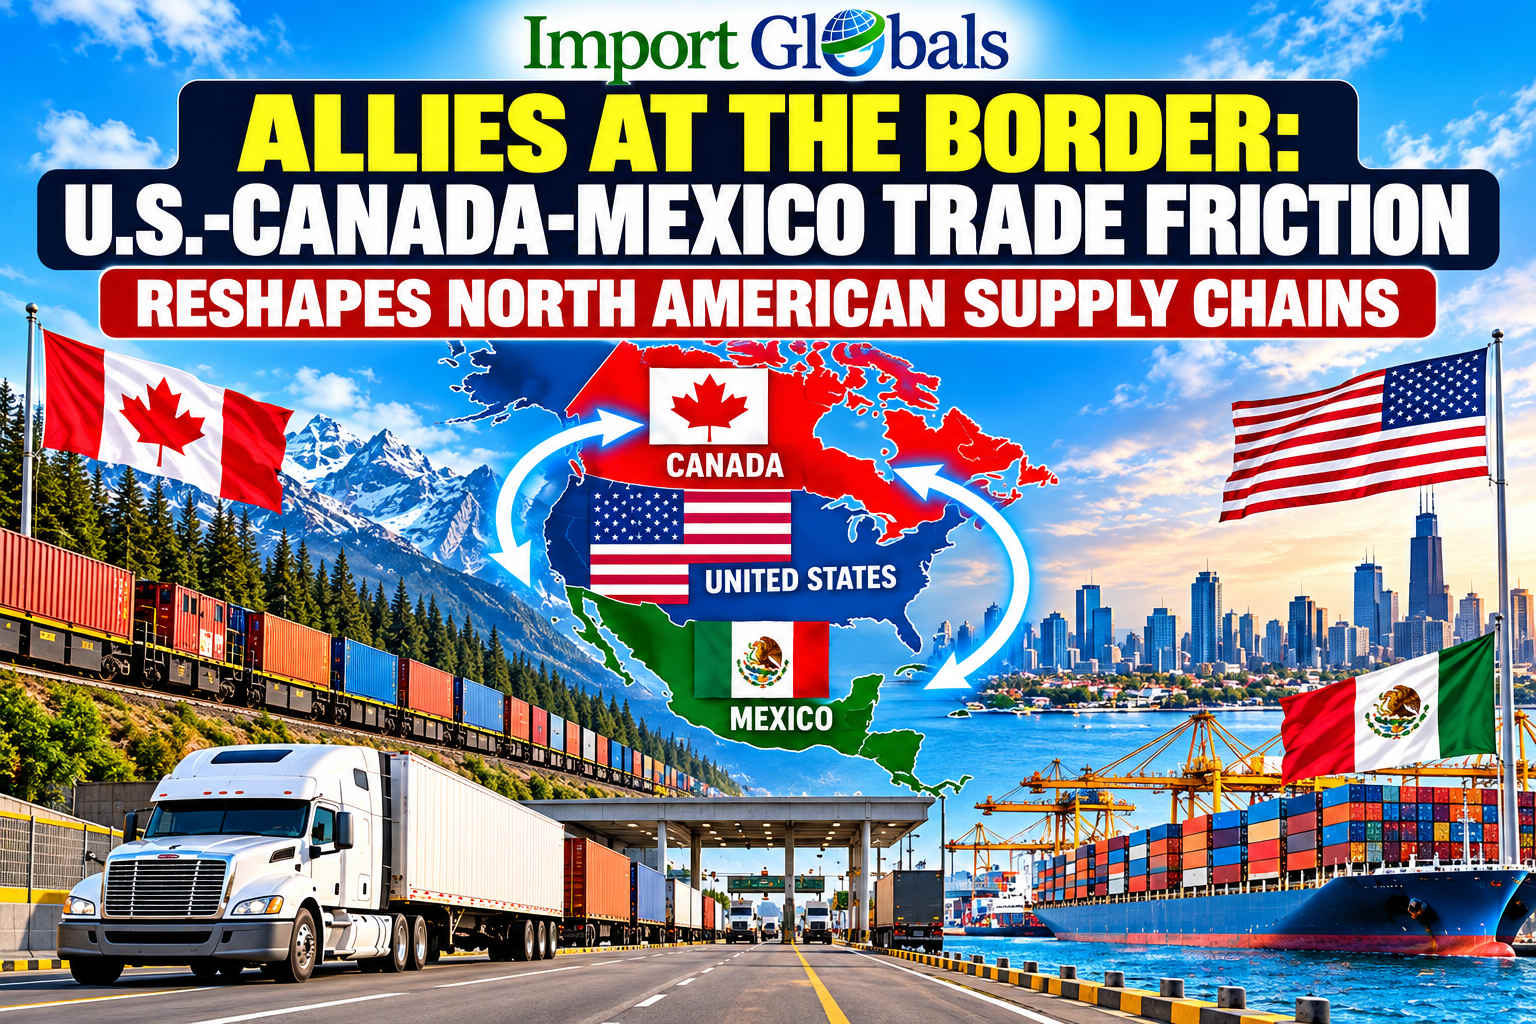
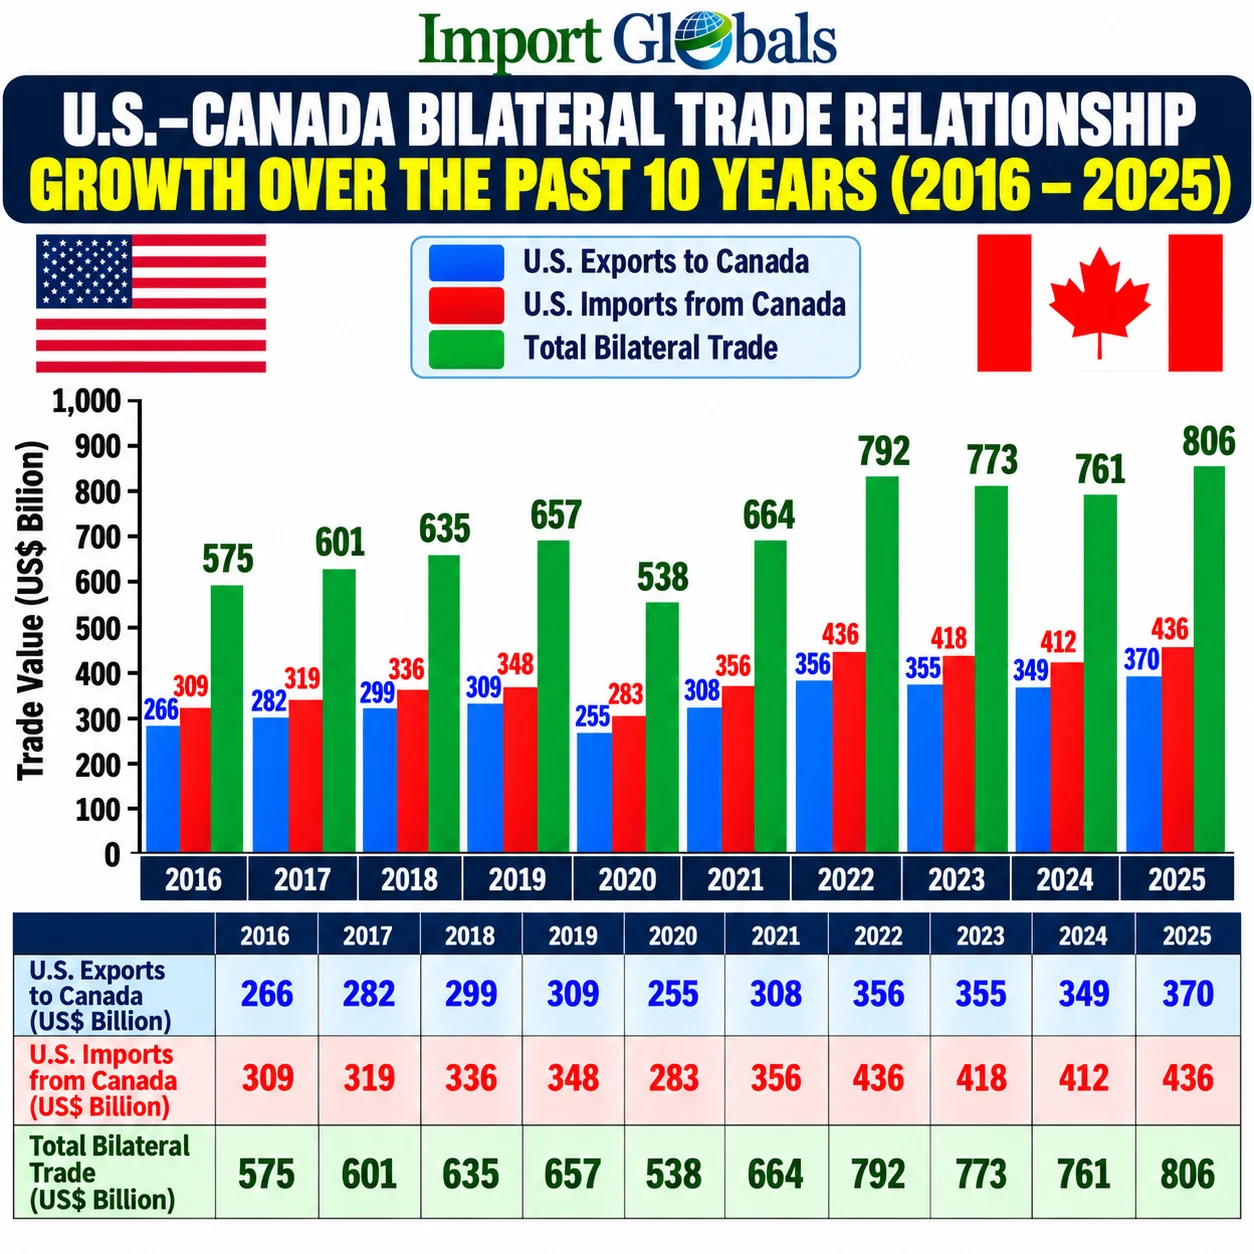
During the year 2025, the trade relations between the three economies remained, but the terms of trade turned into uncertainty. US exports to Canada were at $333.6 billion, while total imports were $381.9 billion, thereby making the overall goods trade worth $715.5 billion, as per US Customs Data.
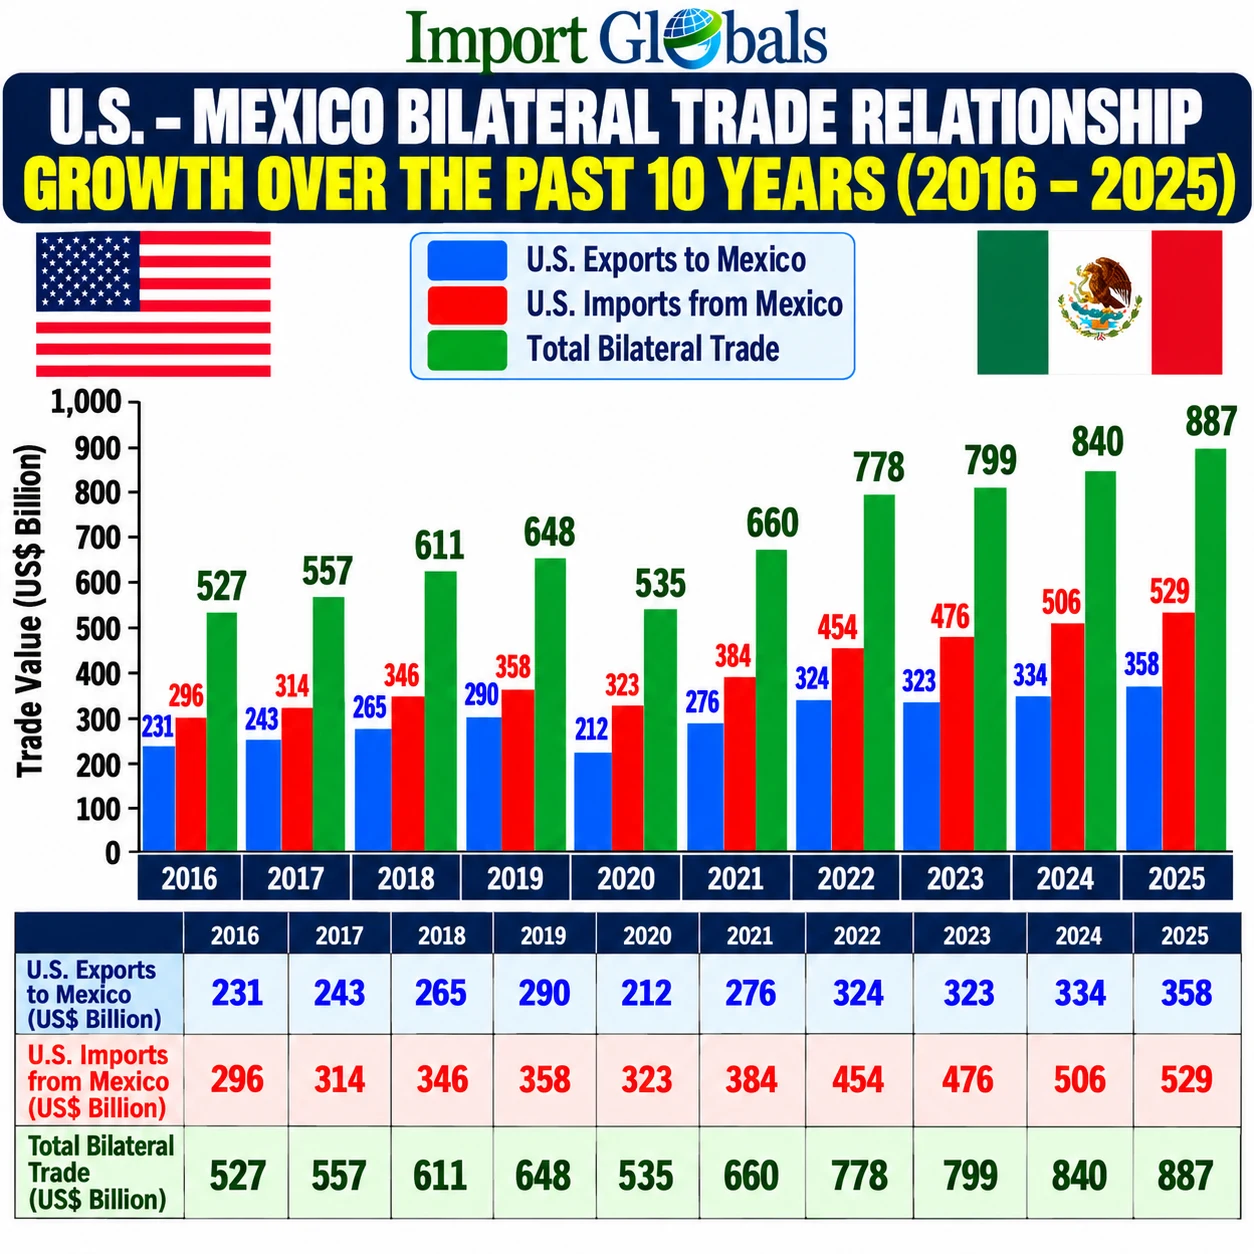
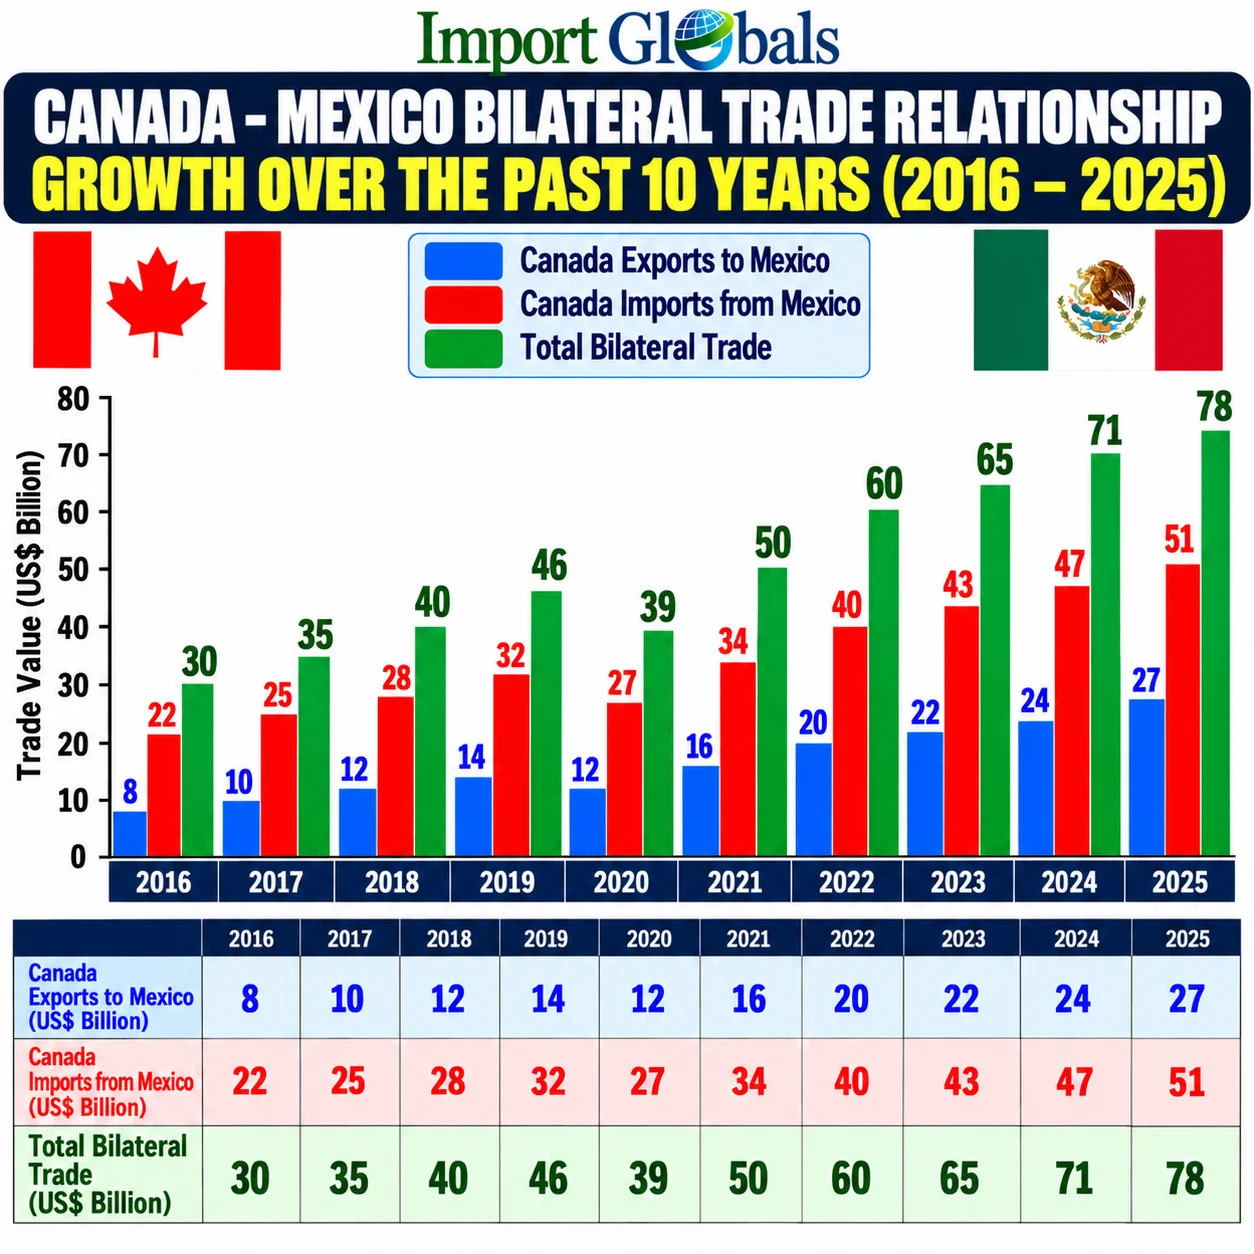
Mexico was large enough to become the Number 1 US trading partner in terms of goods, with total trade worth $872 billion, while imports from Mexico were at $534 billion, thereby leading to an approximate $338 billion in US exports to Mexico. Even the Canada-Mexico trade relations are significant, with exports from Mexico to Canada standing at $21.95 billion, led by vehicles. Together, the trade between the US and its two neighbours accounts for almost one third of the overall international trade of the US.
This density explains the importance of friction. Energy is supplied by Canada, metals and raw materials are offered by Mexico, and the US is known for its capital goods, services and consumer markets. Tariffs, stalled USMCA reviews, and stricter rules regarding origins push all companies to dual-source, keep higher inventories, and think about placing each step of the production process.
Trade Overview of the US, Canada and Mexico
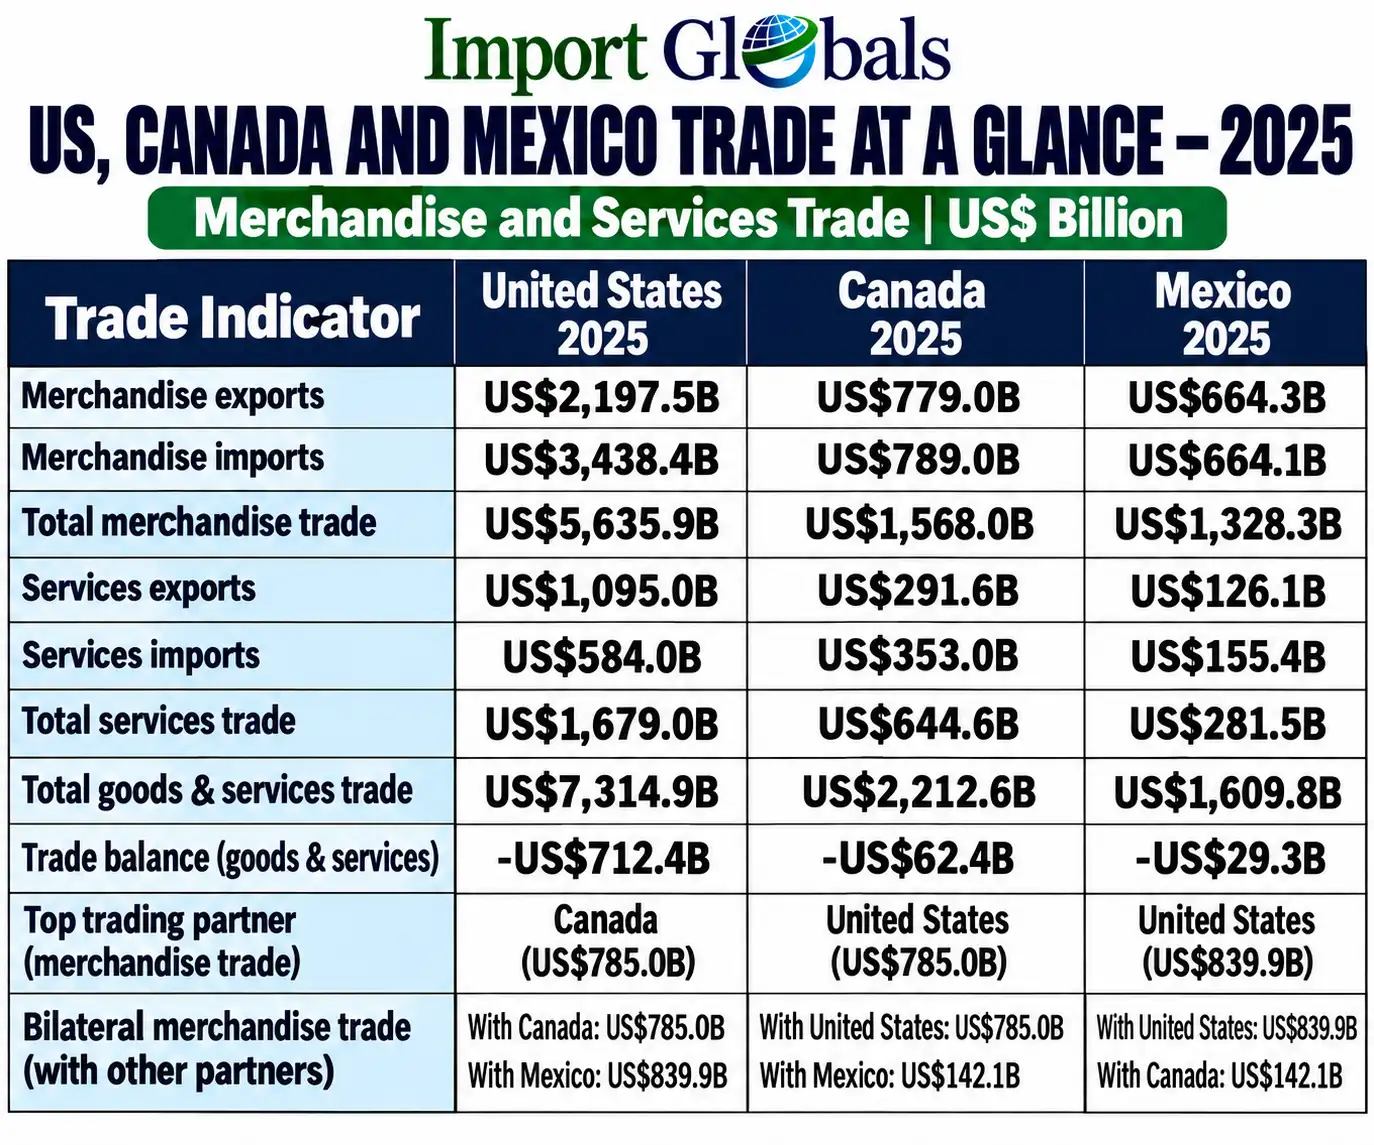
The United States of America, Canada, and Mexico amount to significant figures worldwide in terms of international trade, as evidenced by their respective volumes and values of trade. An example includes the trade of the U.S.A., which reported exports worth $2197.5 billion, imports worth $3438.4 billion, and total trade worth $5635.9 billion. Additionally, the export of services was worth $1095.0 billion against the import of $584.0 billion, which expanded the trading total to $7314.9 billion, recording a deficit of $712.4 billion. Meanwhile, Canada exported $779.0 billion worth of goods against imports worth $789.0 billion, and with services trade of $644.6 billion, the total trade reached $2212.6 billion, recording a deficit of $62.4 billion, says Canada Shipments Data. As for Mexico, the trade was nearly balanced, with exports of $664.3 billion and imports of $664.1 billion, thus bringing the overall total to $1609.8 billion, and the deficit of $29.3 billion. What is more important is that interdependence becomes apparent: trade between Canada and the U.S.A. reached $785.0 billion, while the U.S.A. imported the greatest amount of goods - $839.9 billion from Mexico. Even though the trade between Canada and Mexico was less ($142.1 billion), it was still growing, reported Mexico Shipment Data.
Top 10 Imported and Exported Goods of US in 2025
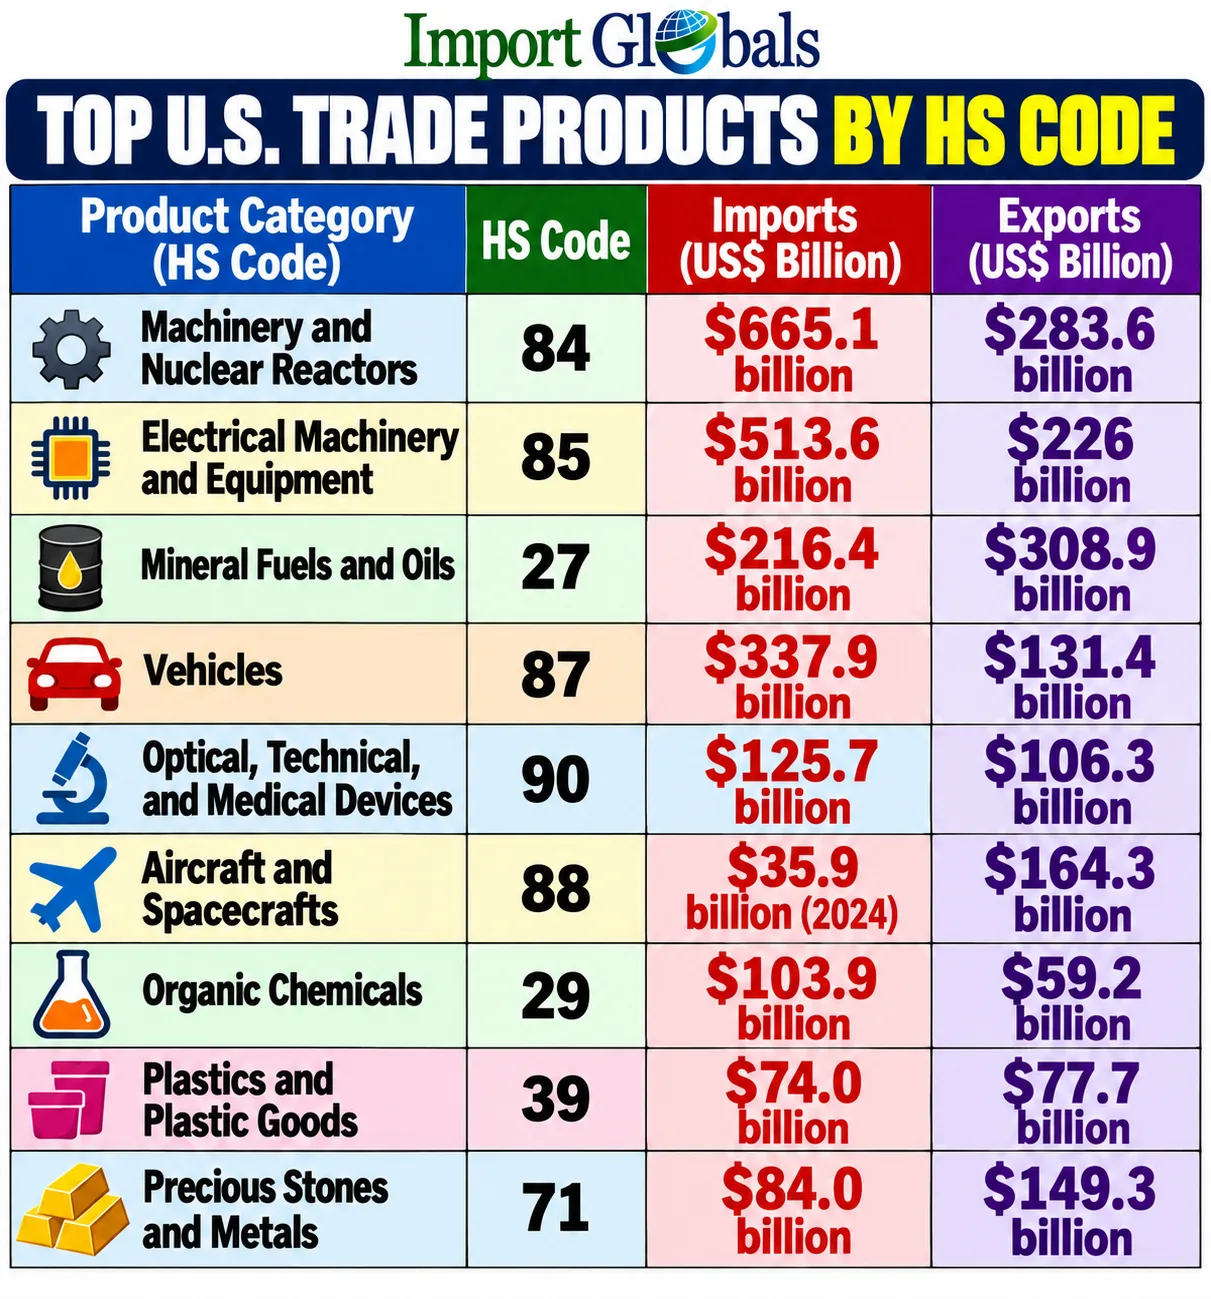
Machinery and Nuclear Reactors (HS 84) | Imports: $665.1 billion | Exports: $283.6 Billion
This sector features transactions of computing machinery, servers, engines, and various industrial products in both directions. The demand for data centers and North American manufacturing make this category the largest among those with two-way trade, although imports outweigh exports in this field, as per US Export Data.
Electrical Machinery and Equipment (HS 85) | Imports: $513.6 billion | Exports: $226 Billion
This sector encompasses semiconductors, mobile phones, and different electronic components that are exported several times throughout the process of their manufacturing. Thus, the US imports more electronics than it sells but exports a considerable volume of chips.
Mineral Fuels and Oils (HS 27) | Imports: $216.4 billion | Exports: $308.9 Billion
Crude oil, fuel products, and LNG are being traded with each other. Although the U.S. is a net exporter of energy, the refineries continue to import large volumes of crude oil, especially from Canada and Mexico.
Vehicles (HS 87) | Imports: $337.9 billion |Exports: $131.4 Billion
The vehicles are the basis of USMCA integration since they include cars, trucks, and components. The vehicles are crossing borders several times in the process of assembly, and the overwhelming majority of imports come from Mexico, Canada, Japan, and Germany.
Optical, Technical, and Medical Devices (HS 90) | Imports: $125.7 billion | Exports: $106.3 Billion
Diagnostic instruments and surgical equipment possess the greatest balance between imports and exports of all major goods, indicative of specialized supply chains in Europe, Mexico, Asia, and North America.
Aircraft and Spacecraft (HS 88) | Imports: $35.9 billion (2024) | Exports: $164.3 Billion
The category includes commercial aircraft, engines, and components, in which America is very strong, and imports are quite minimal, which gives the category the maximum surplus of goods in trade, reported US Trade Statistics.
Organic Chemicals (HS 29) | Imports: $103.9 billion | Exports: $59.2 Billion
The category includes chemical materials used in plastic, pharmaceutical, and agricultural industries, which are moving both ways. The low prices for domestic energy help exports, although the deficit still exists.
Plastics and Plastic Goods (HS 39) | Imports: $74.0 billion | Exports: $77.7 Billion
The category includes resins and polymers, where exports are slightly higher than imports. This is possible due to the large reserves of gas and an effective petrochemical industry serving Canada, Mexico, and China.
Precious Stones and Metals (HS 71) | Imports: $84.0 billion | Exports: $149.3 Billion
Gold, silver, and precious stones are traded through financial markets as well as markets for jewelry. The imports and exports depend on the prices of metals, and their movement volume is also considerable.
Top 10 Common Canadian Imported and Exported Products 2025
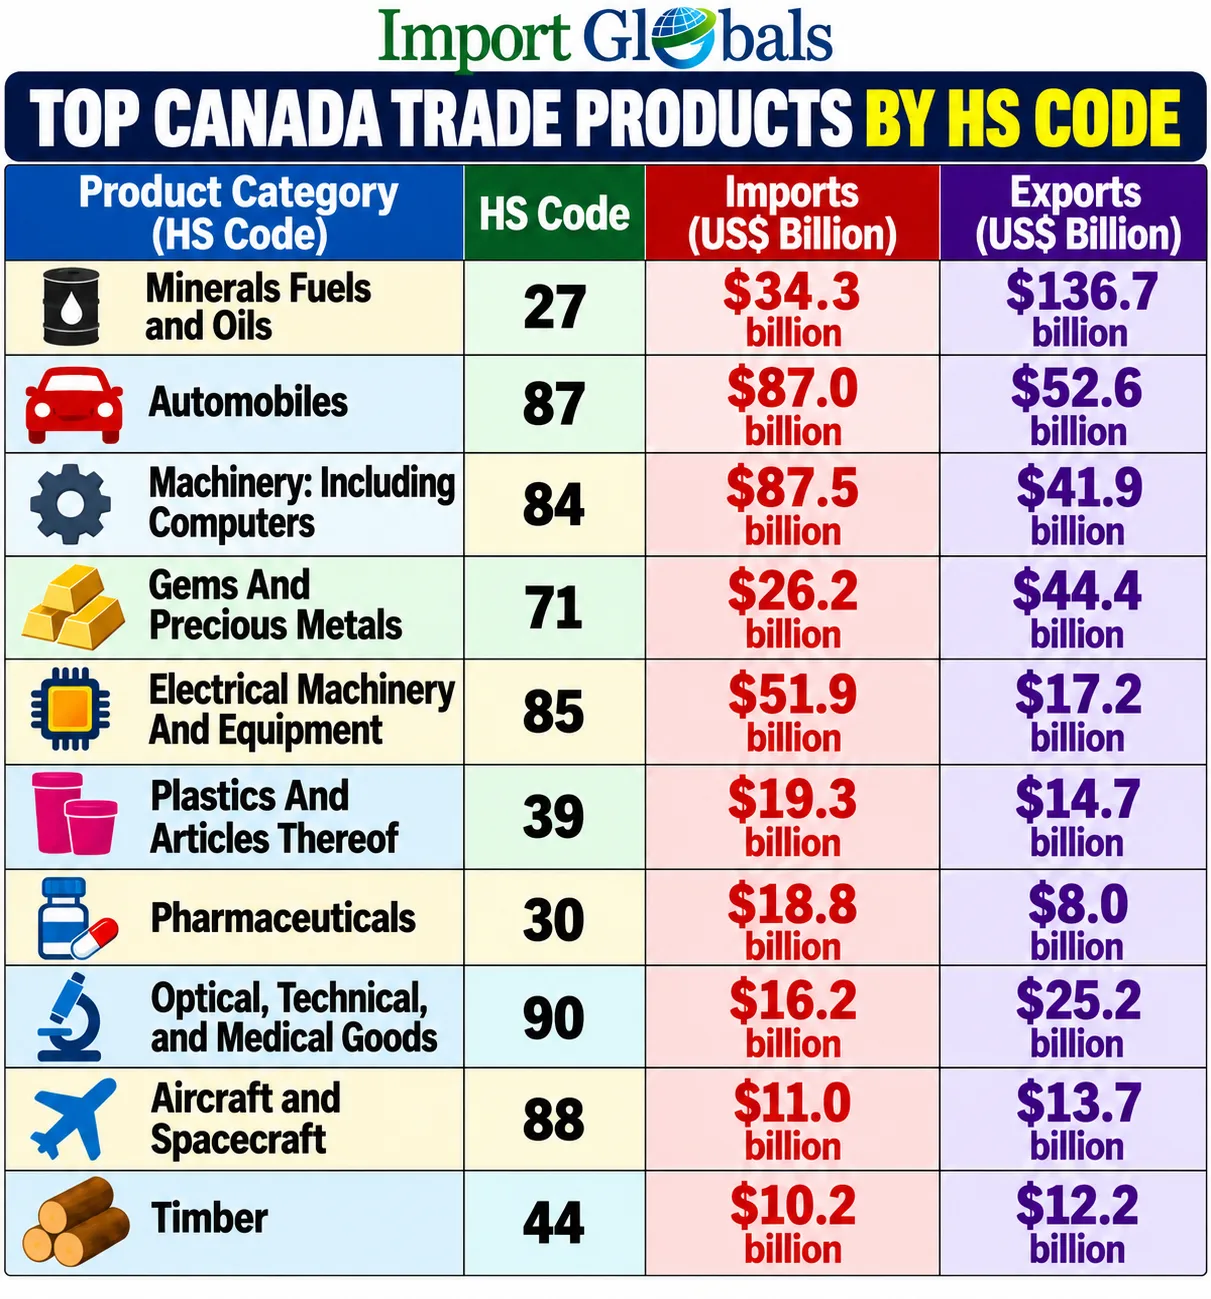
Minerals, Fuels and Oils (HS 27) | Imports: $34.3 billion | Exports: $136.7 Billion
Canada is a tremendous exporter of energy, exporting crude oil and gas and refined goods. Nevertheless, Canada imports refined fuels and crude oil to supply eastern refineries that do not have any access to pipelines from Canada West.
Automobiles (HS 87) | Imports: $87.0 billion | Exports: $52.6 Billion
Goods in the automobile industry move back and forth across the Canada/U.S. border many times in the process of their assembly. Imports are higher than exports, with vehicles from the USA and Mexico taking the lead, as per Canada Import Data.
Machinery: Including Computers (HS 84) | Imports: $87.5 billion | Exports: $41.9 Billion
Canada needs many types of machinery, and it imports computers, engines, valves, and other kinds of machinery extensively, while it only exports a minor amount of industrial machinery to the USA.
Gems and Precious Metals (HS 71) | Imports: $26.2 billion | Exports: $44.4 Billion
The key component of this product category is gold. At the same time, ingots along with refined gold imports experienced a major increase of 36.5% compared to the 2024 level.
Electrical Machinery and Equipment (HS 85) | Imports: $51.9 billion | Exports: $17.2 Billion
Canada continues to be a major net importer of electronics, including cellular phones, cables, converters, and batteries. The production of electrical equipment within the country is low, and the export of electrical goods is only a third of the import volume.
Plastics and Articles Thereof (HS 39) | Imports: $19.3 billion | Exports: $14.7 Billion
Polymers and ready-made plastics are shipped back and forth quite a lot, especially when it comes to trade with the USA. Canada exports a lot of products produced from petrochemical goods; while goods manufactured in Canada are characterized by lower prices, says Canada Customs Data.
Pharmaceuticals (HS 30) | Imports: $18.8 billion | Exports: $8.0 billion (dosage medicines only, HS 3004)
Canada spends much more money on medications than the amount earned through exports. The trade is dominated by European and American pharmaceutical companies.
Optical; Technical, and Medical Goods (HS 90) | Import value: $16.2 billion | Export value: $25.2 Billion
Hospitals and research institutions rely on imported diagnostic and surgical instruments and advanced devices. Canadian exports in this category are very limited.
Aircraft and Spacecraft (HS 88) | Import value: $11 billion | Export value: $13.7 Billion
The aerospace industry, including aircraft and its accessories, exports mainly to the U.S. and Europe. The exports in the industry increased by about 4% in 2025, making this industry one of the few in the manufacturing sector.
Timber (HS 44) | Import value: $10.2 billion | Export value: $12.2 Billion
Softwood timber and processed wood are traditional Canadian exports, but they decreased by 9.7% in 2025 because of U.S. tariffs and slower construction activity; which made this category one of the poorest export categories this year.
Top 10 Common Mexican Imported and Exported Products 2025
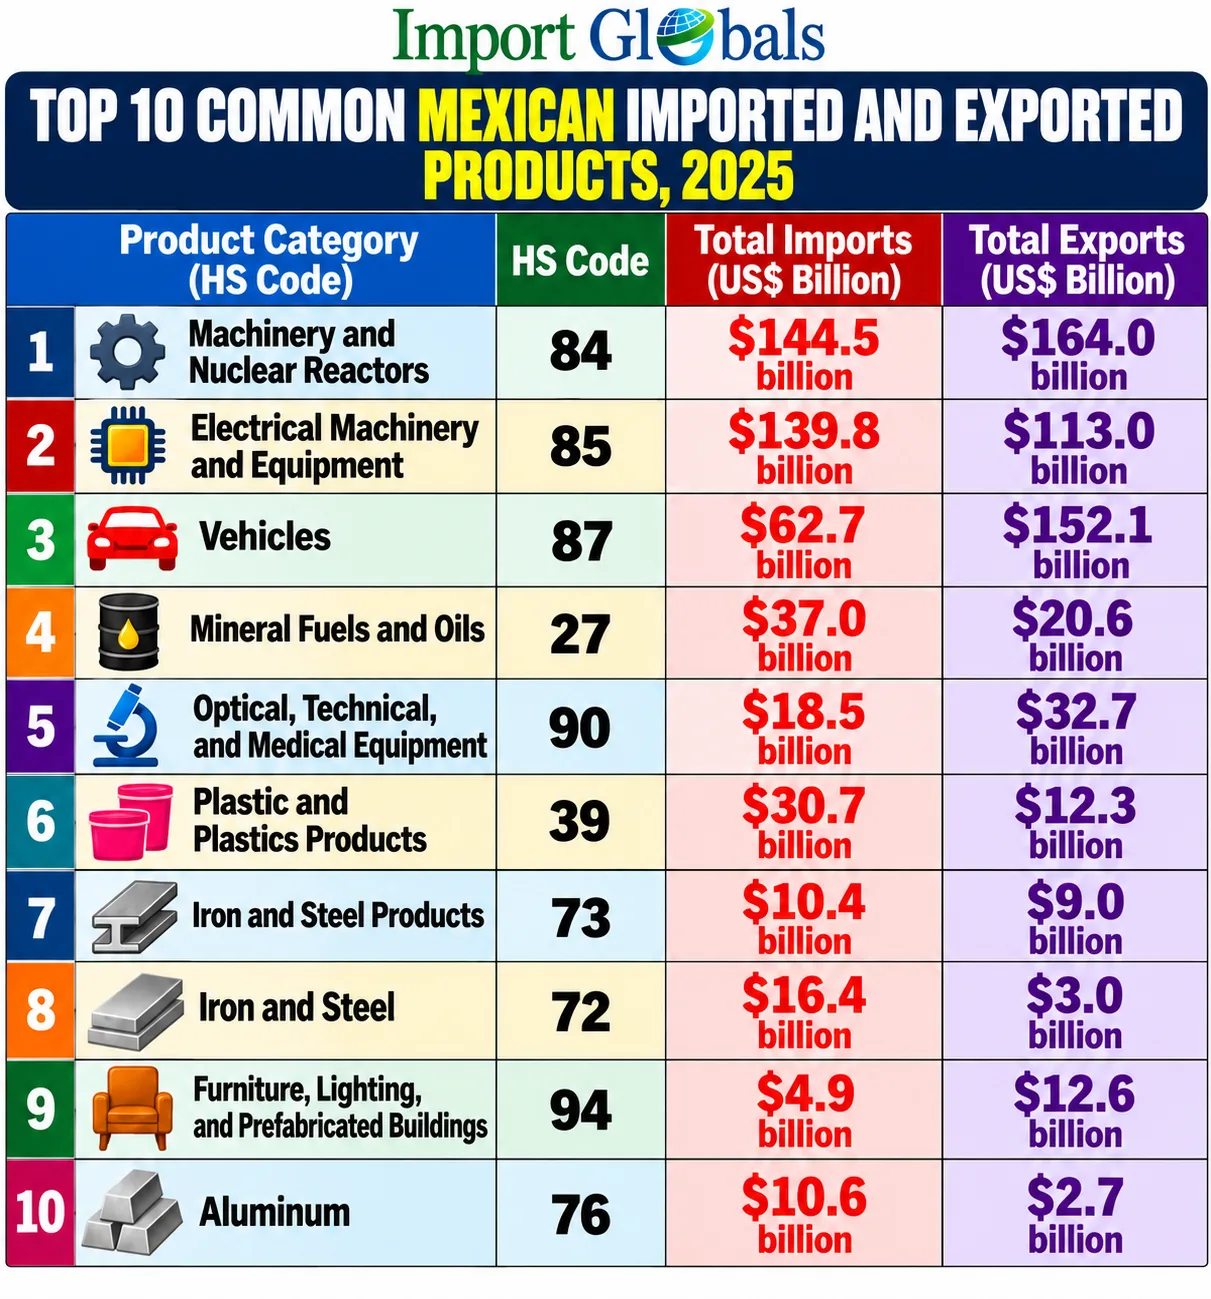
Machinery and Nuclear Reactors (HS 84) | Total Imports: $144.5 billion | Total Exports: $164.0 Billion
Mexico buys machinery and components and arranges the manufacturing of computers, servers, and industrial equipment for the American market. Export value is higher than import value due to the high demand for computing facilities, reported Mexico Export Data.
Electrical Machinery and Equipment (HS 85) | Total Imports: $139.8 billion | Total Exports: $113.0 Billion
The chipsets and other components used in this sector are mostly imported from Asia and the USA, whereas the finished products include televisions, wiring, and electronics. Mexico remains in a deficit as a significant share of value originates from imported goods.
Vehicles (HS 87) | Total Imports: $62.7 billion | Total Exports: $152.1 Billion
Mexico is one of the main car exporters, shipping заr and its parts, including trucks, mainly to the USA, which results in the manufacturing surplus of the industry.
Mineral Fuels and Oils (HS 27) | Total Imports: $37.0 billion | Total Exports: $20.6 Billion
Though its oil reserves allow importing a big volume of refined products of fuel including gasoline and diesel, the raw oil export is not substantial enough to compensate the high imports.
Optical, Technical, and Medical Equipment (HS 90) | Imports: $18.5 billion | Exports: $32.7 Billion
Firms located in border areas manufacture medical goods and precision equipment largely for foreign customers, particularly for those in the United States. Exports are significantly higher than imports, symbolizing the robust performance of Mexican manufacturing.
Plastic and Plastics Products (HS 39) | Imports: $30.7 billion | Exports: $12.3 Billion
Manufacturers engage in the procurement of polymers from U.S. companies in order to produce such products as packaging material, car parts, and household goods.
Iron and Steel Products (HS 73) | Imports: $10.4 billion | Exports: $9.0 Billion
Fasteners, tubes, structures, and other iron works turn in both directions and satisfy the needs of the automobile and construction industries. The trade is somewhat balanced with a slight surge of imports.
Iron and Steel (HS 72) | Imports: $16.4 billion | Exports: $3.0 Billion
The mills located on the territory of Mexico are not able to provide for the entire country’s needs; thus, manufacturers have to import semi-finished and flat steel from the USA, Asia, and the rest of the world.
Furniture, Lighting, and Prefabricated Buildings (HS 94) | Imports: $4.9 billion | Exports: $12.6 Billion
Mexico creates furniture and lighting products for export, with the majority being sold to the United States while the country imports a small fraction of what it exports. The surplus in this category exists but is not comparable to that of other industries, reported Mexico Export Trade Data.
Aluminum (HS 76) | Imports: $10.6 billion | Exports: $2.7 Billion
Since automakers and manufacturers rely on aluminum sheets, extrusions, and ingots for their production, Mexico has to import aluminum from other countries. There is little aluminum produced domestically, which means imports of aluminum greatly surpass exports, and tariffs imposed on metals have a direct effect on this industry.
Bilateral Relationship Analysis of Us, Canada and Mexico Past 10 Years
Tariffs, Threats, and Deadlines: How Policy Is Changing the Landscape
- Security Tariffs Take Precedence Over the Agreement
Currently, the U.S. has imposed a flat 50% tariff on global imports of aluminum, copper, and steel. In addition, the country charges a 25% tariff on non-USMCA-compliant auto and auto parts. Approximately 37% of goods imported from Canada and 32% of goods from Mexico fall under these tariffs, as per Canada Import Statistics.

- New Tariff Fronts Open Up
The Section 301 actions regarding forced labor have impacted 60 countries, including Canada and Mexico. However, Mexican companies maintain that USMCA-compliant goods are not susceptible to such tariffs regardless of the nature of the action.
- Neighbor Responses Differ
Mexico has decided against retaliation, a move that has received praise from U.S. trade representatives. However, Canadians support the imposition of tariffs at a rate of 62%. The USMCA agreement is still active and under review every year, which means that each deadline presents the opportunity to revise the terms.
Flexibility Beats Efficiency; How Corporations Are Reorganizing Their Supply Chains?
- Use Different Suppliers and Keep More Inventory
Hardly anyone can leave North America, as it requires too much investment in factories, suppliers, and the workforce. Instead, they choose to rely on multiple suppliers for the same components and keep larger amounts of stock. Old ways of doing things that demanded minimum stock and the cheapest supplier are replaced by affordable contingencies that protect companies from sudden tariffs and border problems.
- Analyse Supply Chains and Prove Product Origin
Given that rules of origin are currently being revised, companies are analysing supply processes in detail to identify the sources of tariffs. Many manufacturers invest in digital visibility solutions so as to instantly know where their products are from. Large companies can afford this, but small businesses lack compliance departments, says Mexico Import Data.
- Divide the Cost of the Friction
Businesses are changing contracts to make it clear who pays for tariffs. Someone has to pay for resilience measures and logistics transparency. Most likely, the burden will fall on consumers in the form of high prices or middle suppliers with slim profit margins.
Future Trade Outlook
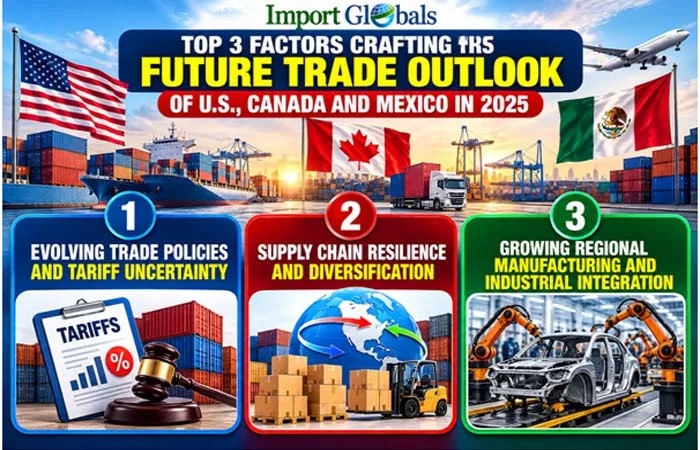
A number of important elements—including regional integration, tariff uncertainties, supply-chain stability, and changing rules of origin—are likely to define the future of US-Canada-Mexico trade relations. The economies in question are characterized by considerable interdependence, one evidence of which can be found in the transportation of oil products, automobiles, machinery, electronics, and metals across the borders of the three countries. Given that such a level of interdependence is attained, one can assume that companies will not withdraw from their North American supply chains but will only seek to make them more flexible and robust.
US tariff policies and USMCA revisions will continue to be instrumental. Companies are likely to increase diversity of their suppliers of goods, maintain larger inventories, have customs and origin documentation available, and take advantage of digital supply-chain visibility technologies.
The automotive and manufacturing supply chains are unlikely to remain unchanged as the components cross the borders multiple times before they form a product. Import flows in respect of energy and raw materials will remain strategically important as Canada serves as an energy producer, while Mexico contributes additional capacity and supplies the necessary raw materials, as per Mexico Trade Data.
Conclusion
The trade relationship between the U.S., Canada, and Mexico is just one example of how intertwined the economies of North America have become. The United States made considerable merchandise trade with both Canada and Mexico in 2025. Additionally, bilateral trade relations were significant between Canada and Mexico.
Nonetheless, what determines the next stage of North American trade is not just the sheer volumes of trade. Rather, the nature of tariffs, USMCA negotiations, rules of origin, border regulations, and geopolitics is shaping corporate choices concerning trade. The greater level of uncertainty forces companies to reconsider the traditional principles of just-in-time and switch to strategies such as supplier diversification, launching inventory buffers, and developing compliance practices.
Thus, a company that trades across borders in North America is starting to realize that trade intelligence is becoming a strategic tool, rather than just reporting.
CTA
Looking for the latest market opportunities on U.S.-Canada and Mexico? You have come to the right platform here. Import Globals helps businesses with detailed information regarding the products traded within all three regions. The shipment-level trade intelligence grabs the marketing strategies of top traders with sourcing opportunities. Subscribe to www.importglobals.com or drop an email at info@importglobals.com for detailed updates on U.S.-Canada and Mexico trade to transform your international business growth.
FAQ’s
Que. Why is the US-Canada-Mexico trade important in current days?
Ans. The US-Canada-Mexico trade is important in current times because it promotes the supply chain coverage of specific industries like automobiles and energy.
Que. Name the countries that are the largest U.S. trading partners among Canada and Mexico.
Ans. Mexico was the largest trade partner of U.S. goods in 2025.
Que. Name the industries affected the most by North American trade friction.
Ans. Automobiles and machinery are the industries affected the most by North American trade friction.
Que. How are the tariffs implemented changing the corporate supply chain?
Ans. Larger inventories and multiple suppliers are being considered in response to the tariffs changing corporate supply chains.
Que. Why is the automotive industry facing particular supply chain pressure?
Ans. The automotive industry is facing particular supply chain pressure because of the sensitivity to tariffs, border delays, and changes in trade rules.
Que. Why are the rules of origin more important?
Ans. The rules of origin are more important because they determine origin for trade policy purposes. Therefore, they need greater visibility into their production and sourcing processes.
Que. How does U.S.-Canada and Mexico import-export data support business growth?
Ans. U.S.-Canada and Mexico import-export data support business growth via proper identification of buyers, suppliers, analysis of market demand, and development of effective market expansion strategies.
Que. What information is available in U.S.-Canada and Mexico trade data?
Ans. U.S.-Canada and Mexico trade data cover importer name, exporter name, shipment date, HS code, product details, quantity, values, pricing information, origin country, importing country, and port details.
Que. How frequently is the U.S.-Canada and Mexico trade data updated?
Ans. U.S.-Canada and Mexico trade data is updated on a monthly basis.
Que. Where can you obtain detailed information on U.S.-Canada and Mexico trade data?
Ans. Visit www.importglobals.com or drop an email at info@importglobals.com for detailed updates on U.S.-Canada and Mexico trade data.
You Can Also Visit :-
