
Resource Nationalism & Critical Mineral Restrictions: Impact on Global Import-Export Trade
- Oct 10, 2026
- 70 Views
Resource Nationalism & Critical Mineral Restrictions: Impact on Global Import-Export Trade
Minerals are the raw material behind nearly every modern industry, and their trade remains one of the largest flows in the global economy. Trade in critical minerals alone was worth $2.5 trillion in 2023, with Asia emerging as the world’s largest importing market, and demand has kept rising through 2025 as the energy transition, battery and electric vehicle manufacturing, semiconductors and data infrastructure expand.
China sits at the centre of the import side: its imports of metal ores, slag and ash were valued at $239 billion, accounting for 64% of global imports of such commodities by value. The United States depends heavily on foreign supply as well, reported Global Shipments Data.
Net imports of processed mineral materials reached $185 billion in 2025, feeding downstream industries that generated an estimated $4.05 trillion in value. On the export side, resource-rich nations such as Australia, Canada, Chile, Peru, Indonesia, South Africa and the Democratic Republic of the Congo supply copper, iron ore, lithium, cobalt, nickel, gold and rare earths to manufacturing hubs across Asia, Europe and North America. With tariffs, export controls and supply-chain security shaping sourcing decisions; Global Import Export Data has become essential for finding buyers, vetting suppliers and tracking price movements across this fast-changing market.
What Is Resource Nationalism?
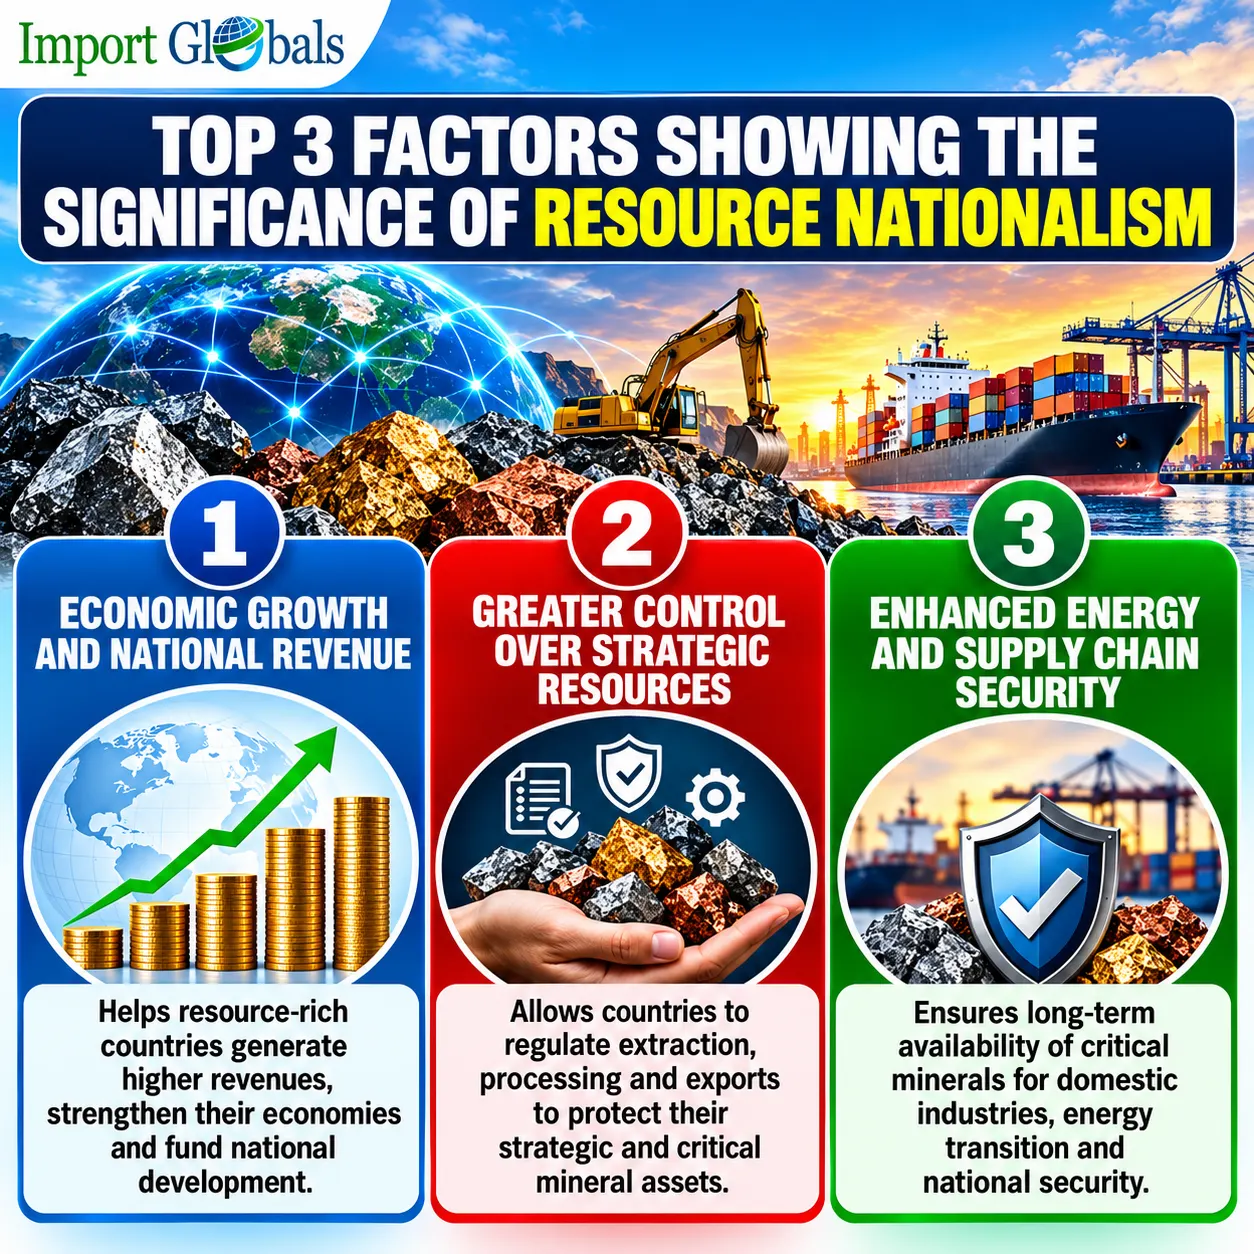
Resource nationalism is defined as governmental interference in circumstances dealing with natural resources. Instead of allowing raw minerals to be exported from the country to be processed abroad, resource nationalism aims to reduce outflow profits by introducing such measures as export restrictions, quotas, taxation, licensing, state ownership, etc. Moreover, foreign and local governments’ economic restrictive policies have begun to spread worldwide with the emergence of many countries that implement such measures.
There are two main reasons for the emergence of resource nationalism. Firstly, the countries that extract resources want to have more added value by shifting the raw material production into processing factories, which, in turn, will bring them more money in the form of taxes. Secondly, countries that consume natural resources will use protectionist measures in order to secure their strategic branches of industry, says Global Trade Statistics.
Global Mineral Trade Overview
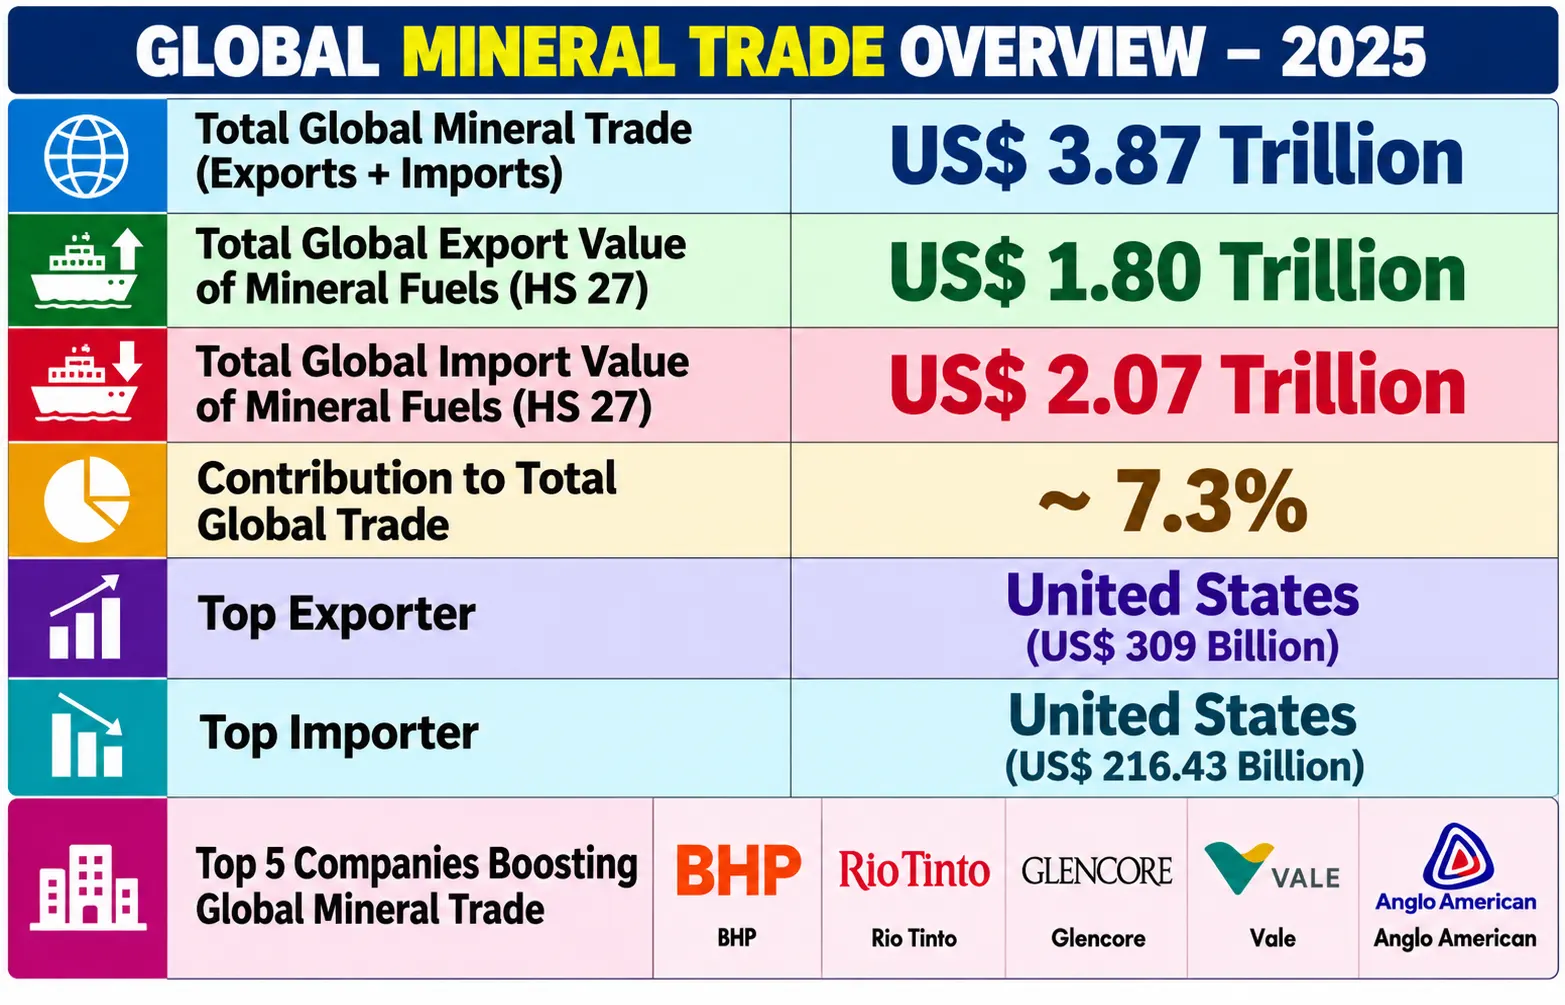
In the year 2025, global mineral trade was one of the vital sectors in the world economy, with export and import values at an impressive US$3.87 trillion. An interesting point was that mineral fuels (HS 27), which include crude oil, natural gas, coal, and refined goods, accounted for US$1.80 trillion of exports and US$2.07 trillion of imports, or about 7.3% of the total external trade. The United States of America was demonstrated to be both the biggest exporter and the biggest importer of minerals, with exports worth US$309 billion and imports of US$216.43 billion, respectively, asp per US Shipments Data.
US, being among the leading countries of the world in the field of energy production and consumption, supports the global energy trade to a great extent. As to the side of suppliers, prominent companies in the field of resources such as BHP, Rio Tinto, Glencore, Vale, and Anglo American continued to contribute to the activity and development of global mineral trade through transportation of large amounts of ores, metals, and energy resources to consumers from Europe, Asia, and North America.
Top 5 Resource Nationalism and Restriction Cases in 2025
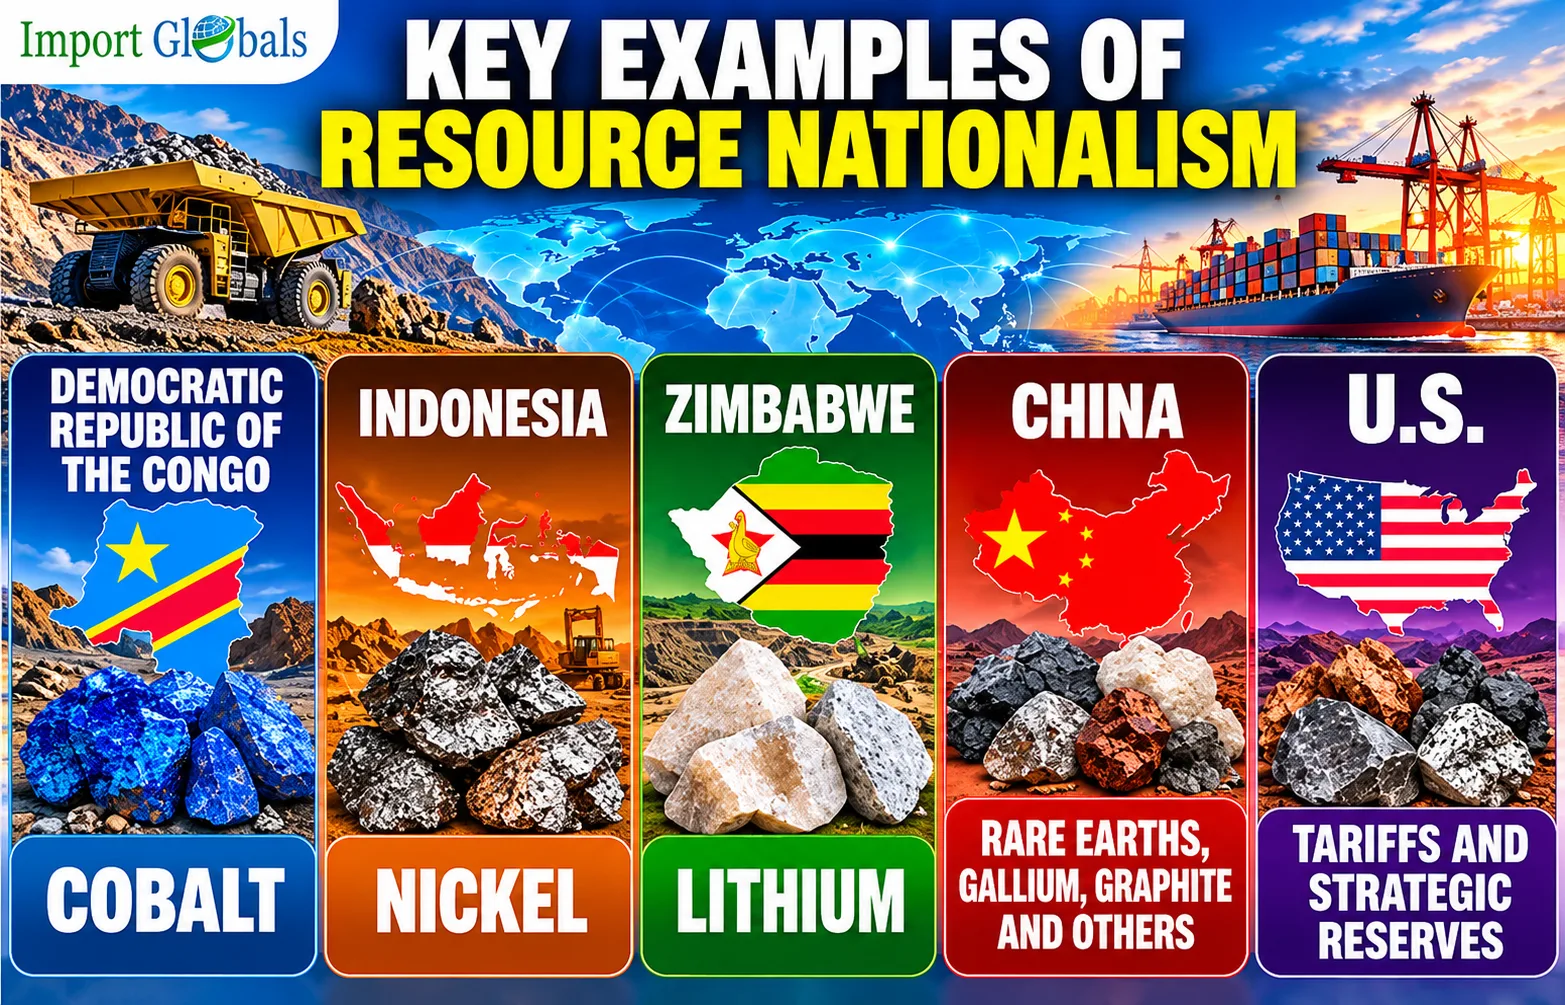
- Democratic Republic of the Congo – Cobalt
The Congo accounts for approximately 70% of the global supply of cobalt. The restrictions imposed by the country in early 2025 came after the price of cobalt had dropped to a nine-year low in February. The ban was lifted on 16 October 2025, replaced by a rigid quota system. The export volume for the rest of 2025 was restricted to 18,125 tonnes, while the 2026 margin was set at 96,600 tonnes. The quota for the year will be lower than half of the country's production in 2024 until 2027.
- Indonesia – Nickel
Indonesia remains the top producer of nickel in the world, reported Indonesia Shipment Data. In 2020, it implemented a ban on the export of unprocessed nickel and required manufacturers to process nickel in the country itself. This has resulted in a boom of smelters constructed with the help of Chinese funds. The policy was continued in 2025.
- Zimbabwe – Lithium
Zimbabwe imposed a ban on unprocessed lithium ores in December 2022 and is planning to reapply the ban in 2027. The country contributes around 8% to global lithium production, and in 2025, it sent approximately 1 million tons of spodumene concentrate to China, which amounted to about 15% of Chinese lithium imports. Namibia and Malawi are also implementing the prohibition of unprocessed mineral exports.
- China – Rare Earths, Gallium, Graphite and Others
China utilizes export regulation as both an industrial and diplomatic measure. Restricted rare earth exports were imposed as a reaction to the conflict with Japan in 2010 and then again in response to U.S. tariffs in 2025. Later in 2025, the country stopped imposing export restrictions on rare earths, graphite, gallium, and other strategic minerals within the bilateral agreement with Washington.
- U.S. - Tariffs and Strategic Reserves
The U.S. is an import-heavy economy with many important metals removed from its 2025 tariff list. Thanks to its enormous reliance on imported raw materials, Washington has decided to lift tariffs on a number of metals such as copper, lithium, nickel, cobalt, manganese, natural graphite, silicon, rare earth elements and pet coke. However, the American authorities are also promoting domestic processing and stockpiling of essential minerals, as well as signing long-term supply agreements with partner countries.
Effect of Resource Nationalism on Global Import and Export Trading Patterns
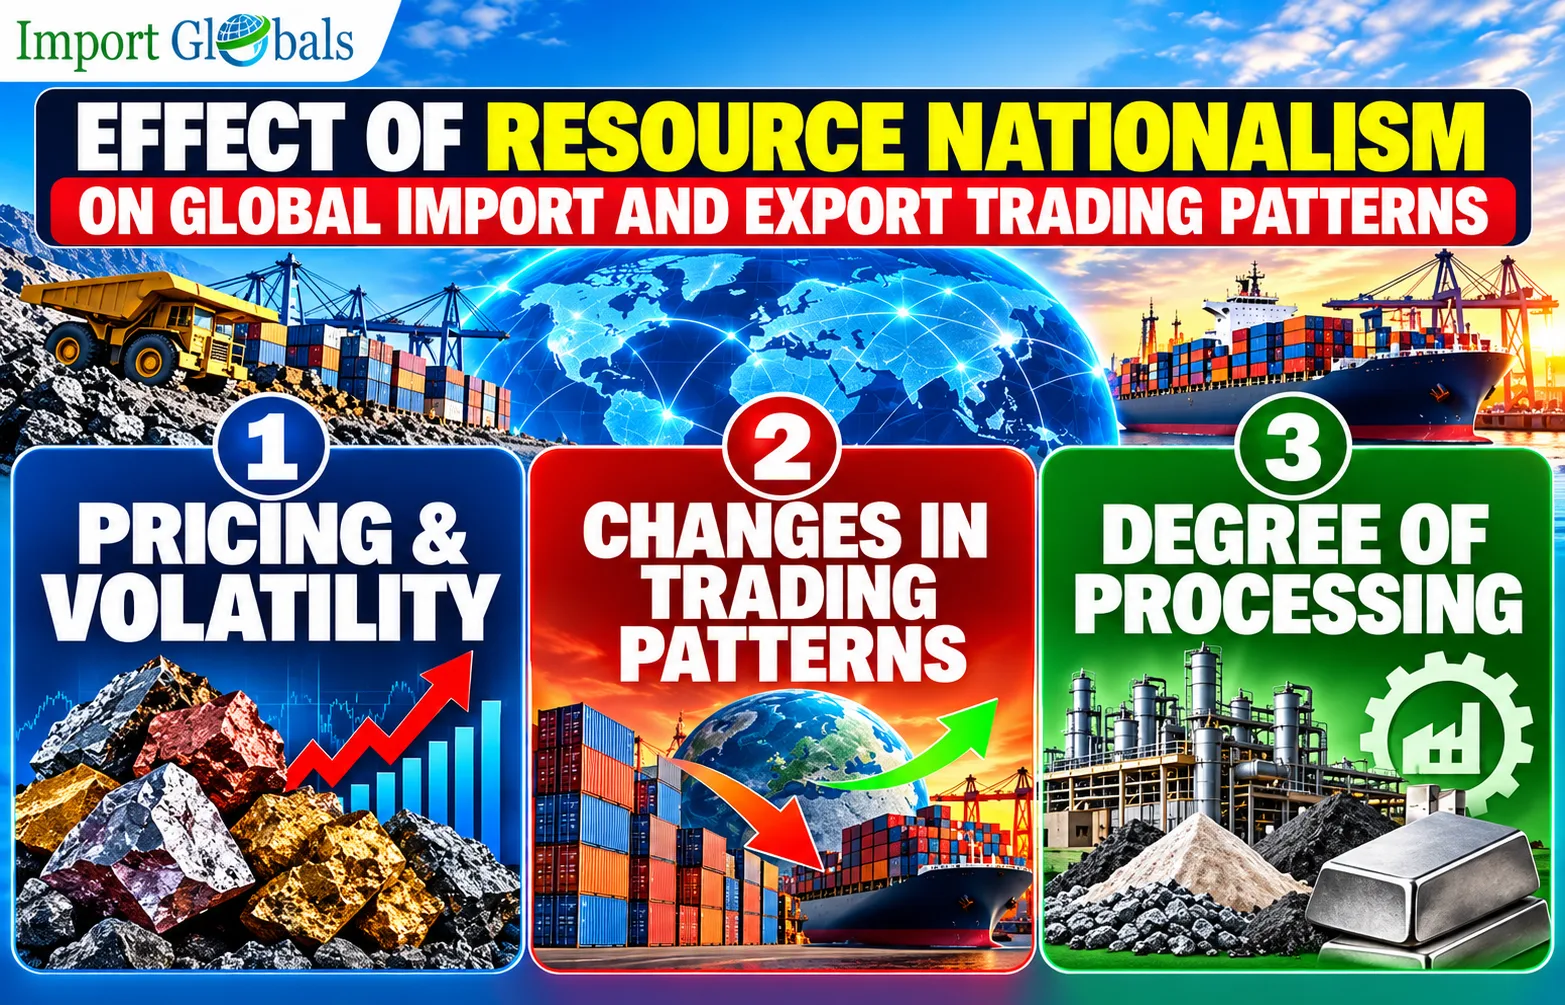
Pricing & Volatility
The prices now are heavily determined by the decisions made by governments. For instance, in the year 2026, the prices of nickel and lithium were reacting more to the supply constraints imposed by the government than to demand in end consumer markets. The cobalt market gives the clearest indication of this phenomenon. In the case of cobalt, the supply controls imposed in the DRC led to a sharp escalation in prices after experiencing the lows in early 2025. Some analysts suggest that there will be a deficit in the future due to the reductions in supply from the DRC while the demand for batteries continues to grow.
Changes in Trading Patterns
With the restriction imposed on the export of raw minerals, the trade patterns have changed from being ore-based to being product-based. Indonesia is now exporting nickel products instead of nickel ore, while African exporters are preparing for the local production of lithium and cobalt. Buyers that used to buy the unprocessed minerals from these exporters are now forced to buy semi-finished products from other companies which were previously not involved in this business.
Degree of Processing
Limitations do not always diminish the leading processor. Chinese companies possess significant interests in Congolese and Indonesian mining companies, giving them advantages in quota regulations. China Molybdenum, the largest cobalt producer in the world, has produced 61,073 metric tons of cobalt in the first half of 2025, which is an increase of 13% despite the export limitations of the DRC, reported Global Trade Data.
Top 10 Globally Traded Mineral Fuels of 2025
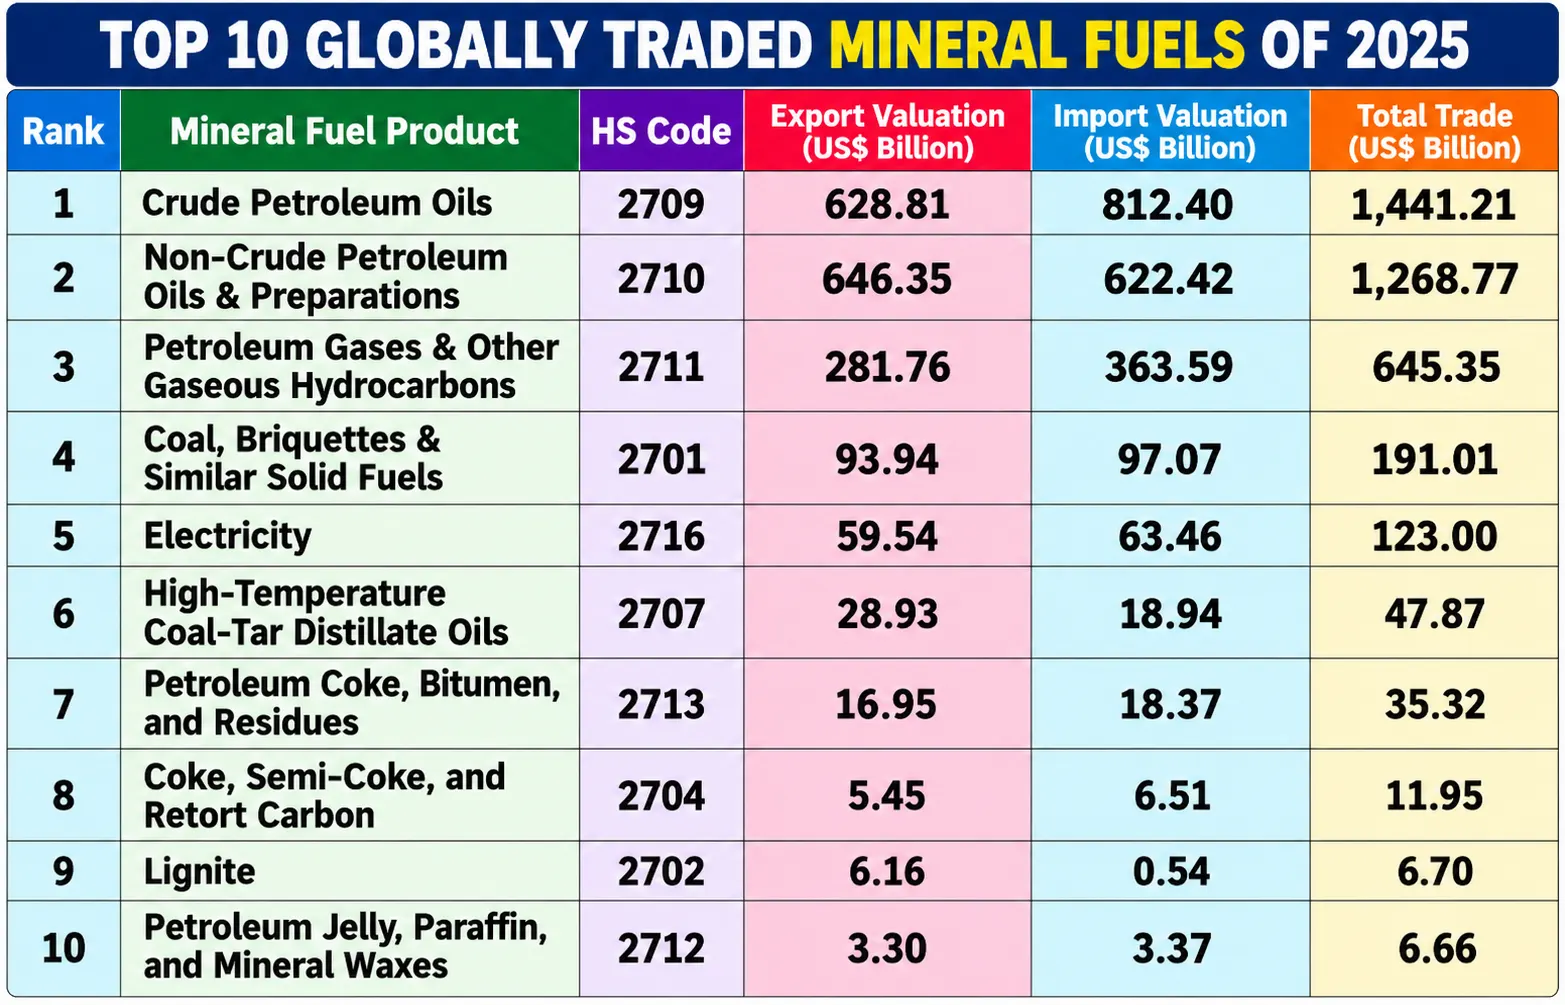
1. Crude Petroleum Oils – HS CODE 2709
Valuation for Export: US$628.81 billion | Valuation for Import: US$812.40 billion | Trade together: US$1.44 trillion
Crude oil is one of the biggest traded energy commodities globally, supporting refineries, transportation, and petrochemicals; as well as providing electricity generation and energy security for major importing economies.
2. Non-Crude Petroleum Oils & Preparations – HS CODE 2710
Valuation for export: US$646.35 billion | Valuation for import: US$622.42 billion | Trade together: US$1.27 trillion
Refined petroleum products contributed to the huge international trade flows, such as fuels, petroleum preparations, and waste oils used in transportation, manufacturing, and other applications in the energy sector, aviation, and maritime industry.
3. Petroleum Gases & Other Gaseous Hydrocarbons – HS CODE 2711
Valuation for export: US$281.76 billion | Valuation for import: US$363.59 billion | Trade together: US$645.35 billion
Petroleum gases are playing a supportive role in worldwide energy markets, with natural gas and other gaseous hydrocarbons being used for electricity production, industrial purposes, heating, petrochemical manufacture, and the development of the liquefied gas chain.
4. Coal, Briquettes & Similar SOLID Fuels — HS CODE 2701
Export value: US$93.94 billion | Import value: US$97.07 billion | Total trade: US$191.01 billion
Coal has been a primary fuel used worldwide, particularly in electricity generation and steel production, as well as in industrial boilers and energy-heavy processes in countries that rely on the importation of solid fuel.
5. Electricity — HS CODE 2716
Export value: US$59.54 billion | Import value: US$63.46 billion | Total trade: US$123.00 billion
Electricity supply across borders has connected neighbouring electricity markets and enabled countries to meet their power demand, increase grid reliability, utilize excess electricity generation, and improve regional energy integration through interconnected networks.
6. High-Temperature Coal-Tar Distillate Oils — HS CODE 2707
Export value: US$28.93 billion | Import value: US$18.94 billion | Total trade: US$47.87 billion
The coal tar distillate oils are used in chemical and industrial sectors, providing input materials for downstream industries producing specialty chemicals, solvents, and aromatic substances in the framework of international industrial supply networks.
7. Petroleum Coke, Bitumen, and Residues – HS CODE 2713
Export value: $16.95 billion | Import value: $18.37 billion | Trade value: $35.32 billion
Petroleum coke, bitumen, and petroleum residues are essential for cement manufacturing, infrastructure construction, industrial processing, energy generation, and other uses, helping create a trade network unique to this category of products versus traditional hydrocarbons.
8. Coke, Semi-Coke, and Retort Carbon – HS CODE 2704
Export value: $5.45 billion | Import value: $6.51 billion | Trade value: $11.95 billion
Coke and similar solid fuel products are often used as industrial raw materials by metallurgical and steel industries, as well as in high-temperature processing and manufacturing where carbon sources are needed.
9. Lignite – HS CODE 2702
Export value: $6.16 billion | Import value: $542.73 million | Trade value: $6.70 billion
Lignite, or brown coal, is used for energy generation, but has lower international trade value than other coal types as it is more economical to source from local markets.
10. Petroleum Jelly, Paraffin, and Mineral Waxes – HS CODE 2712
Export value: $3.30 billion | Import value: $3.37 billion | Trade value: $6.66 billion
Petroleum-based waxes are used in packaging, candle making, cosmetics, and other industries, helping to establish a unique trading relationship between producers and users of such products.
Top 10 Globally Leading Traders of Mineral Fuels in 2025
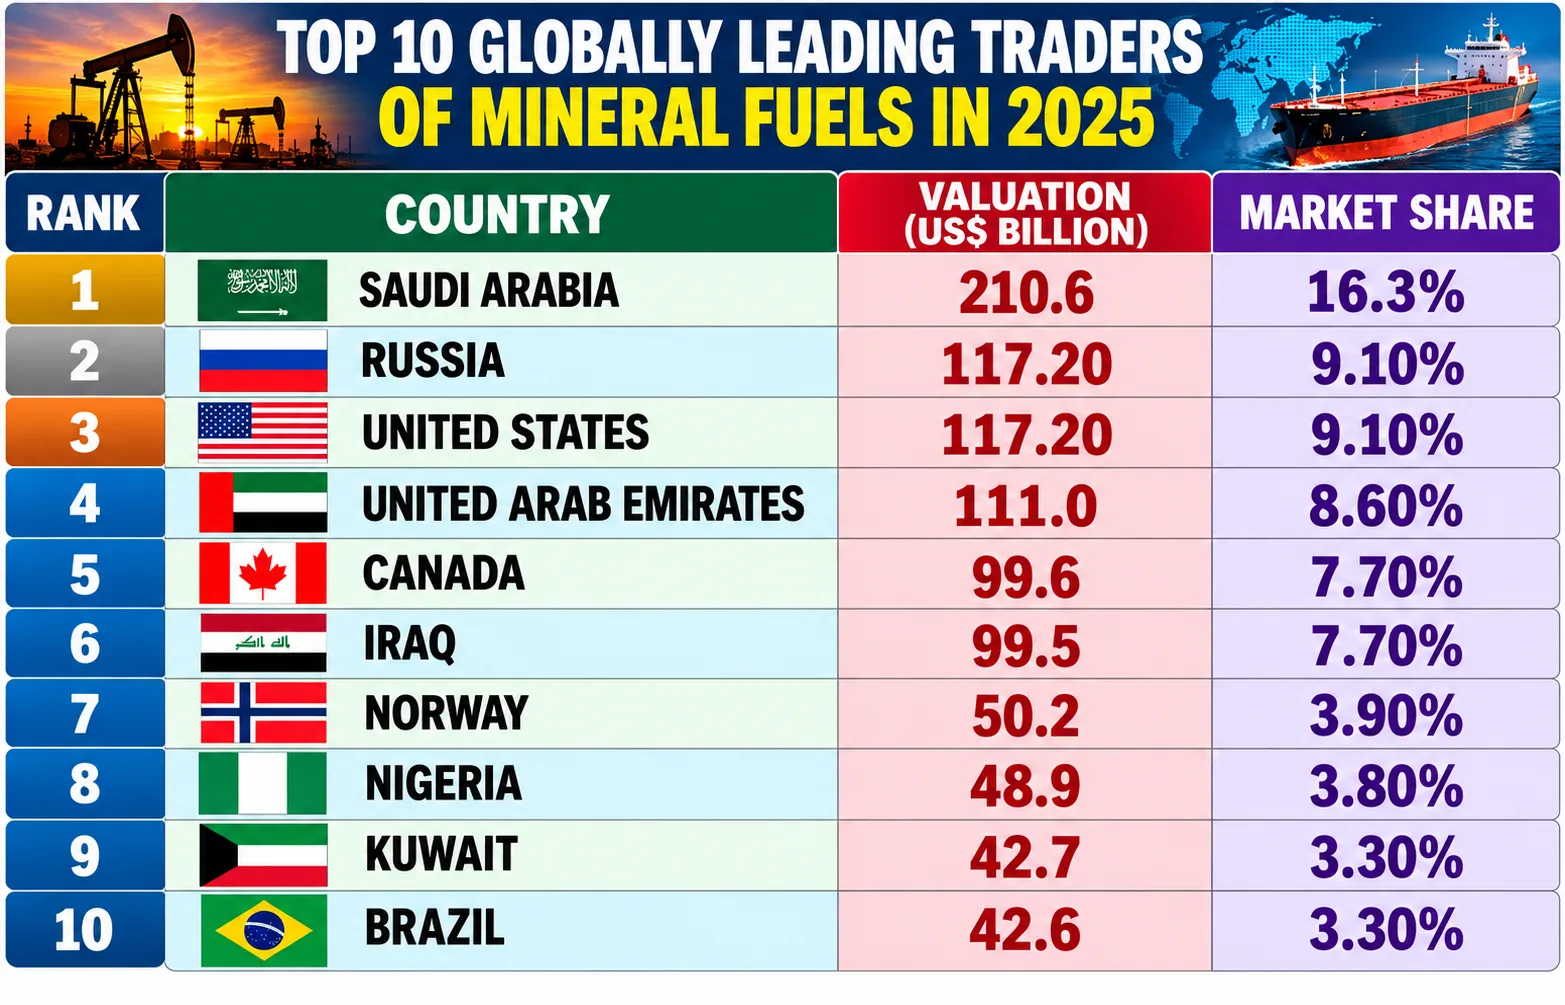
- Saudi Arabia - Valuation: 210.6 Billion | Market Share: 16.3%
Saudi Arabia is extremely influential with regard to mineral fuel exports—the country has large reserves of crude oil, has the capacity to produce oil at low costs, and is also very important for OPEC+.
- Russia — Valuation: $117.20 Billion | Market Share: 9.10%
Due to the economic sanctions established by Western authorities, Russia has found new partners to export crude oil and refined oil products, mainly focusing on Asian countries—India and China, in particular.
- United States Reservation: $117.20 Billion | Market Share: 9.10%
Owing to the shale revolution that took place in the country, the USA was able to utilize its infrastructure in such a way as to export a considerable amount of crude oil, refined oil products, and natural gas all around the world.
- United Arab Emirates — Valuation: $111.0 Billion | Market Share: 8.60%
The United Arab Emirates uses its weighty geopolitical position along with the state-sponsored production capacity, led by ADNOC, to export stable volumes of crude oil and refined products mainly to fast-growing Asian markets.
- Canada — Valuation: $99.6 Billion | Market Share: 7.70%
Canada’s extensive oil sands production blends easily into North America’s pipeline networks, making it an essential and closely integrated energy trading partner mostly for the manufacturing and refining industries in the United States.
- Iraq — Valuation: $99.5 Billion | Market Share: 7.70%
As one of the major contributors to OPEC, Iraq’s economy is entirely dependent on its large oil fields in the South. It continues to export significant amounts of crude oil to meet the growing industrial needs of Asia.
- Norway — Valuation: $50.2 Billion | Market Share: 3.90%
Norway is among the leading energy exporters in Europe in terms of both quality crude oil and the construction of natural gas pipelines for the energy security of Western Europe.
- Nigeria — Valuation: $48.9 Billion | Market Share: 3.80%
Nigeria is Africa’s largest exporter of energy, noted for its low-sulphur-content Bonny Light crude oil, which is sought around the world by refineries trying to meet ever more complicated international fuel demands.
- Kuwait – Valuation: $42.7 Billion | Market Share: 3.30%
Kuwait possesses significant oil reserves that are administered through government-operated enterprises that ensure consistent supply of oil to Asia’s lucrative refineries.
- Brazil – Valuation: $42.6 Billion | Market Share: 3.30%
Brazil has become a contender among Latin American exporters with its vast deep-water pre-salt oil deposits that have created a presence in the international oil markets, supplying oil from Brazil.
Past 10 Years Statistical Analysis of Global Minerals Trade
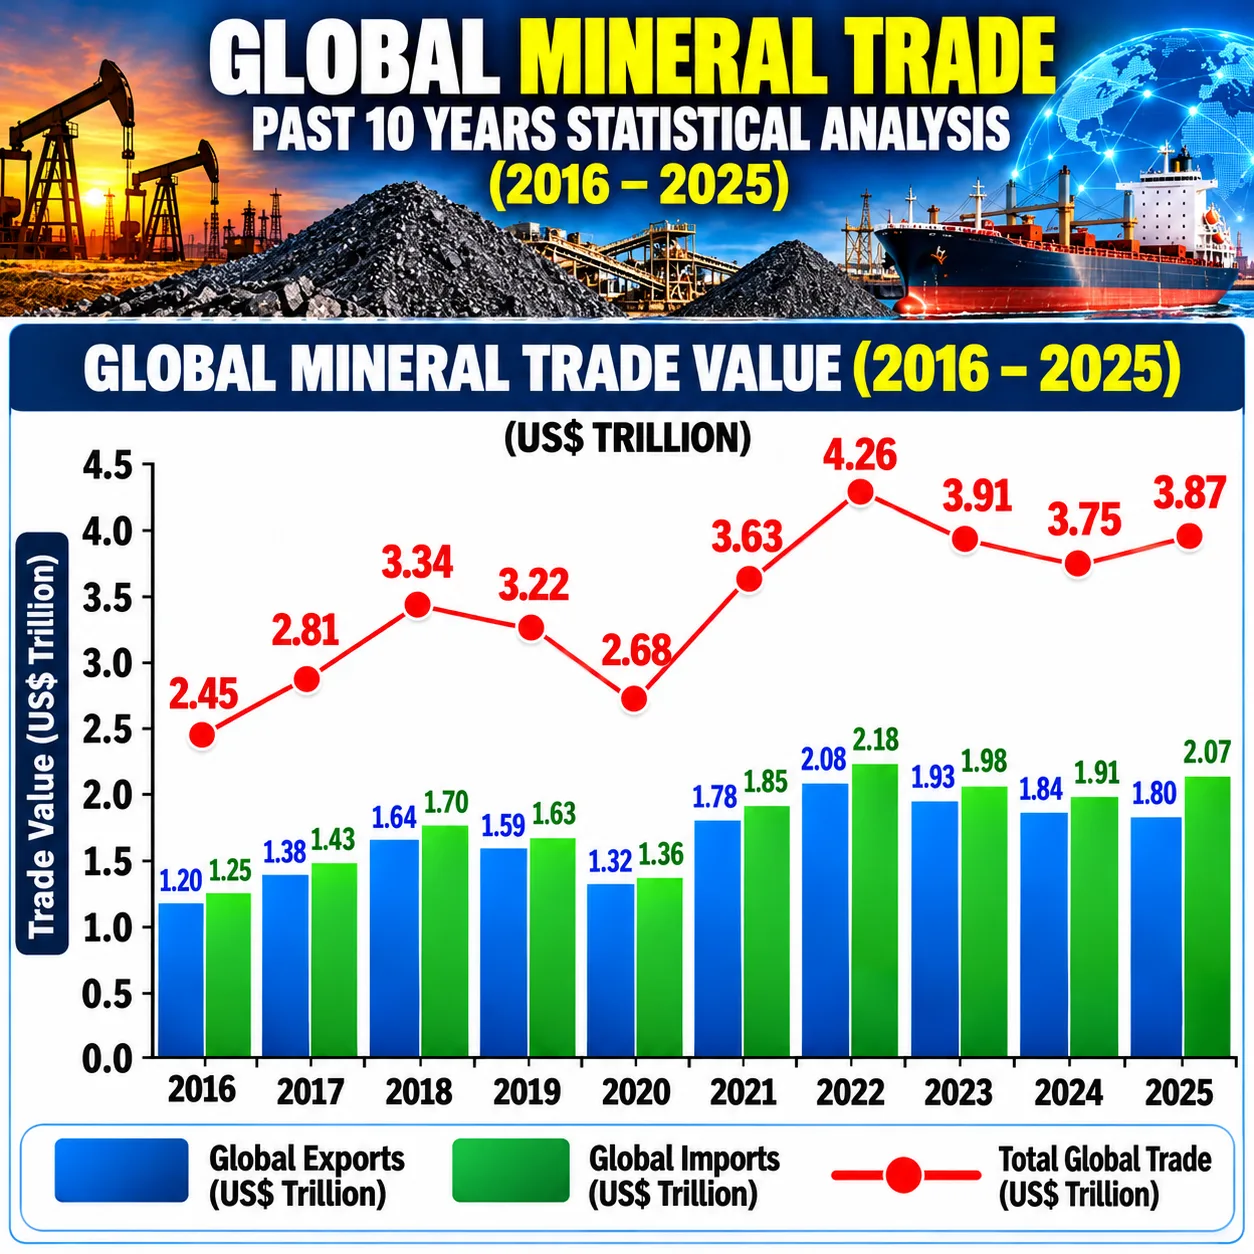
In recent years, the mineral industry has undergone substantial transformations amidst changes in the energy market, prices of commodities, level of industrial output, and international supply chains. The period from 2016 to 2025 has seen the overall volume of international mineral trade soar from an estimated value of US$2.45 trillion to US$3.87 trillion (a period related to the increase in international trade from US$1.20 trillion to US$1.80 trillion, with imports increasing from US$1.25 trillion to US$2.07 trillion).
The international trade sector grew rather successfully until 2018, when the mineral trade reached its highest value of US$3.34 trillion, with the industry falling to US$2.68 trillion due to the outbreak of the COVID pandemic after that, as per Global Import Export Shipment Data. In 2021, international mineral trade achieved great success and reached a value of US$3.63 trillion, thus holding the record for 2022 in terms of the cost of international mineral trade reaching US$4.26 trillion. This change was driven by rising commodity prices and unstable conditions in the energy market, in conjunction with trade operations declining in 2024, when the value of international mineral trade was US$3.91 trillion, but still managed to improve its performance to US$3.87 trillion.
Main Three Obstacles Influenced by Resource Nationalism and Restrictions on Strategic Minerals
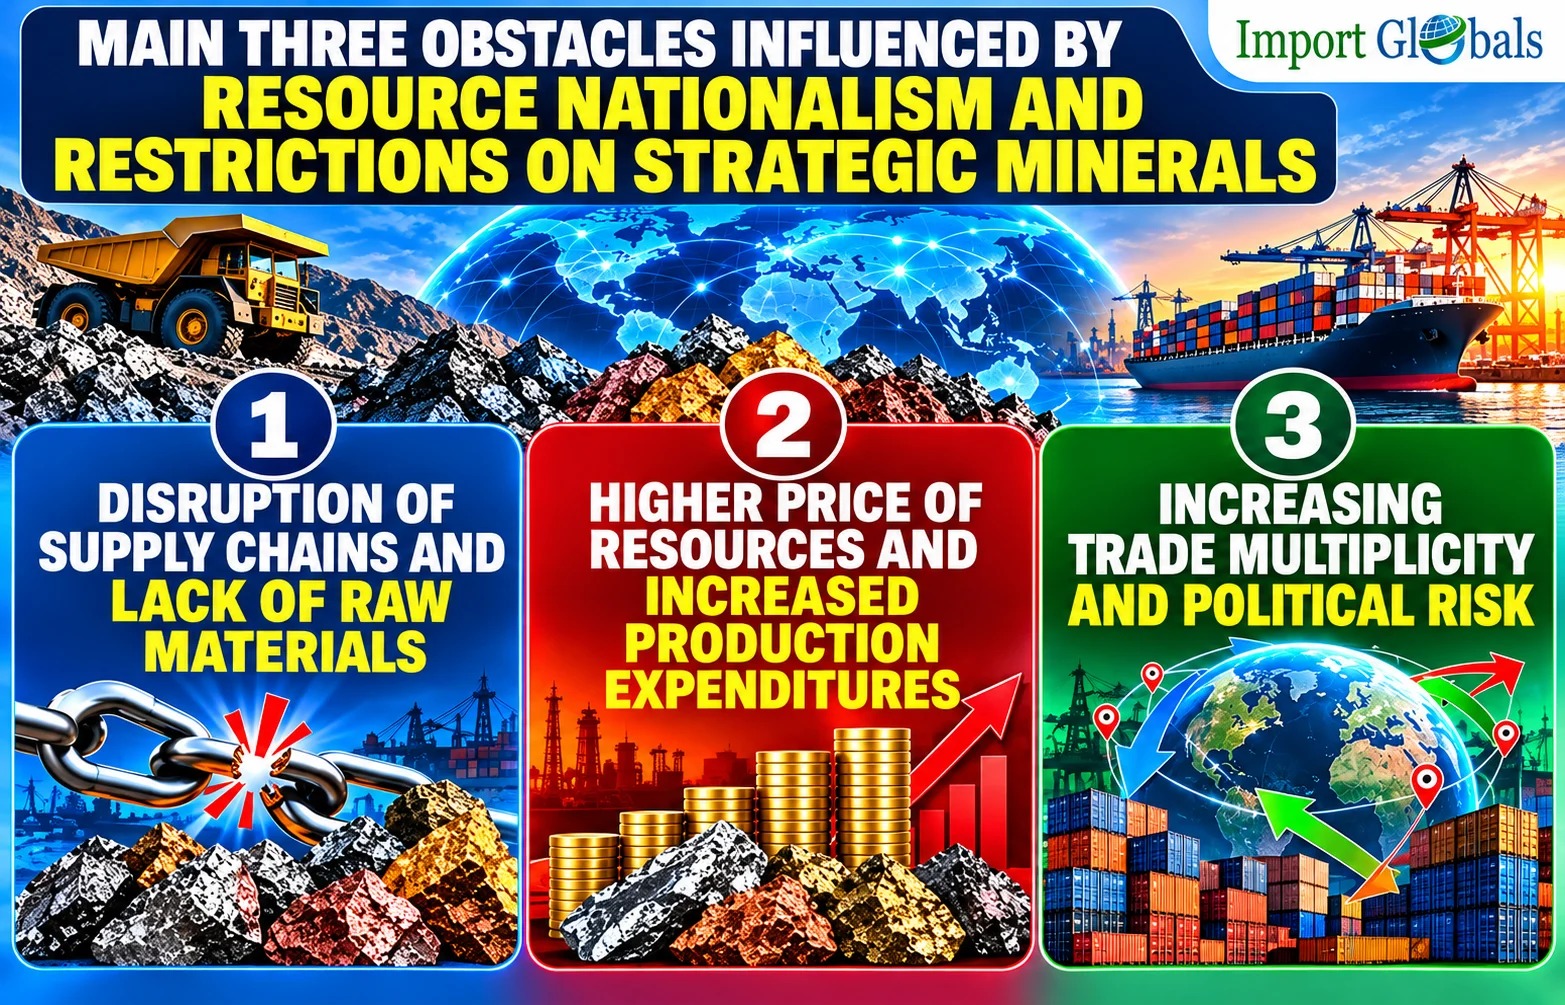
1. Disruption of Supply Chains and Lack of Raw Materials
Restrictions on exports and license requirements, as well as the quota system and embargoes on strategic minerals, negatively impact existing supply chains. The companies that rely on the procurement of lithium and cobalt, as well as other strategic minerals, face the need for the establishment of other suppliers and locations of mining operations.
2. Higher Price of Resources and Increased Production Expenditures
With big producers of minerals tightening restrictions on exports or giving preference to processing of materials locally, the total supply of raw materials on the external market decreases. This leads to an increase in prices of raw materials and production expenses for battery producers, manufacturers of electronic devices, producers of renewable energy, automobile producers, and other industries that are in need of strategic materials.
3. Increasing Trade Multiplicity and Political Risk
Resource nationalism promotes the diversification of markets by importing countries and companies. Companies are required to look for alternative locations for mining, suppliers, transport channels, and production facilities.
How Importing Regions Are Responding to Resource Nationalism & Critical Mineral Restrictions?
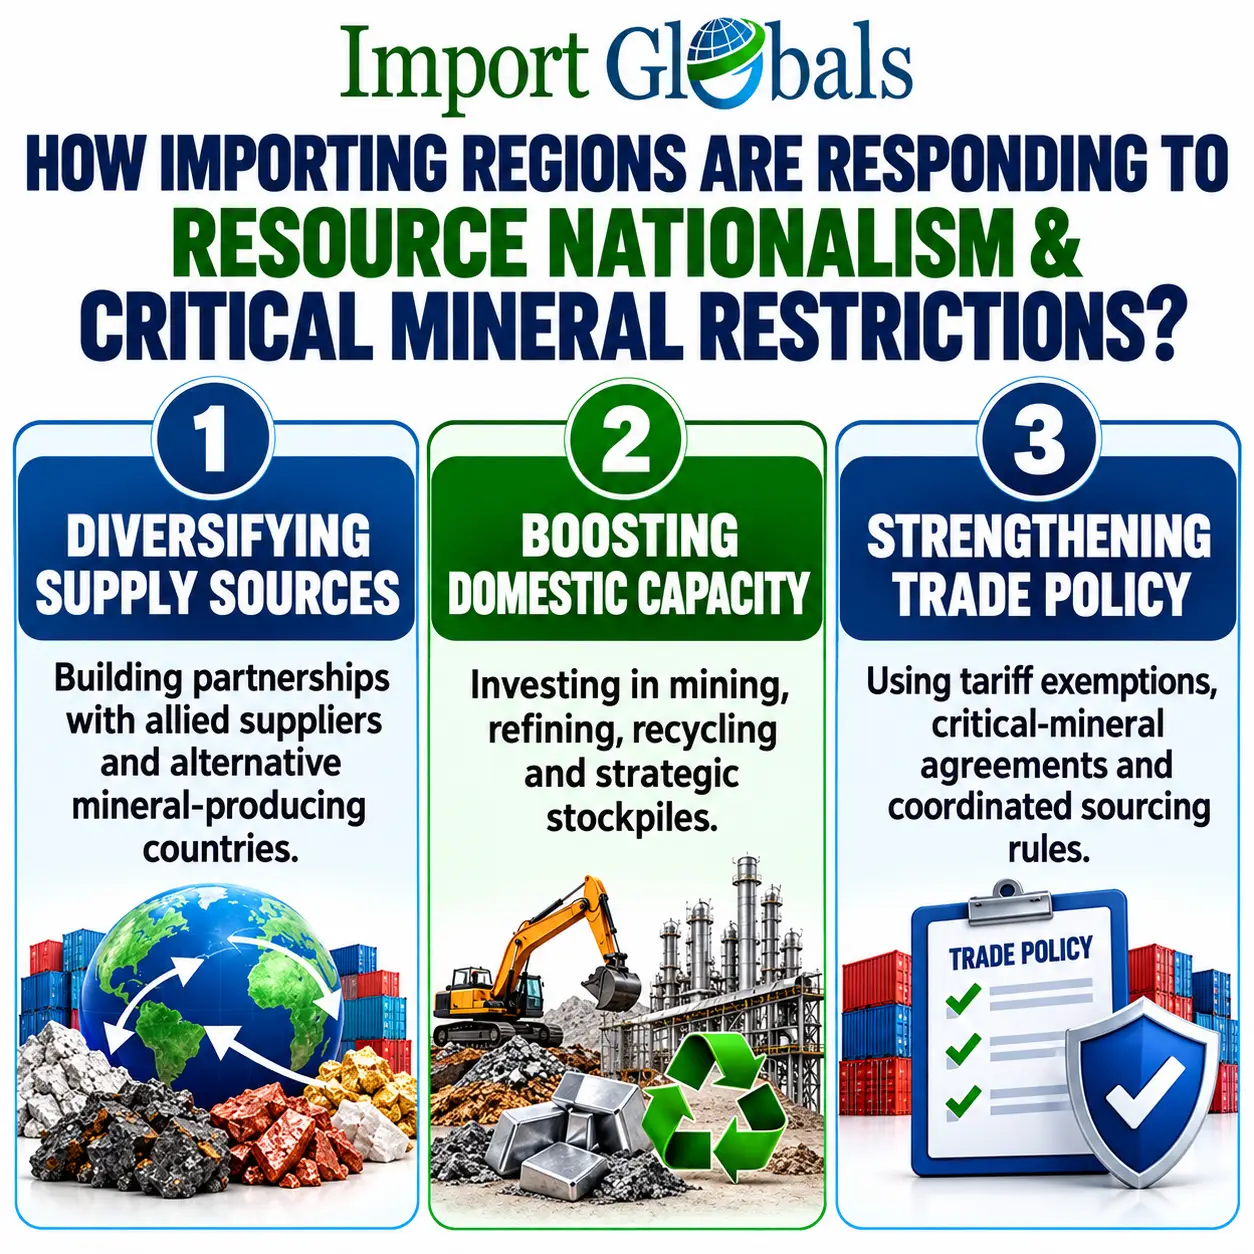
- United States - The response mainly consists of providing tariff exemptions for crucial minerals, supporting local mining and processing, and developing partnerships with allied suppliers.
- European Union - The Critical Raw Materials Act establishes targets as of 2030 that 10% of the consumed materials should be produced via local extraction, 40% via local processing, and 25% via recycling, with no more than 65% of the relevant material coming from only one country.
- Asia - Japan, South Korea, and India accumulate reserves, sign long-term supply contracts, and invest in overseas mines. Asia remains the leading importer, and all restrictions directly affect its industrial sector, says Asia Trade Data.
- Canada and Australia - Both countries work towards becoming reliable providers. The value of Canada’s exports of critical minerals increased by 3% to C$49.4 billion by 2025, which approximates US$35 billion.
Future Trade Outlook of Global Mineral Trade
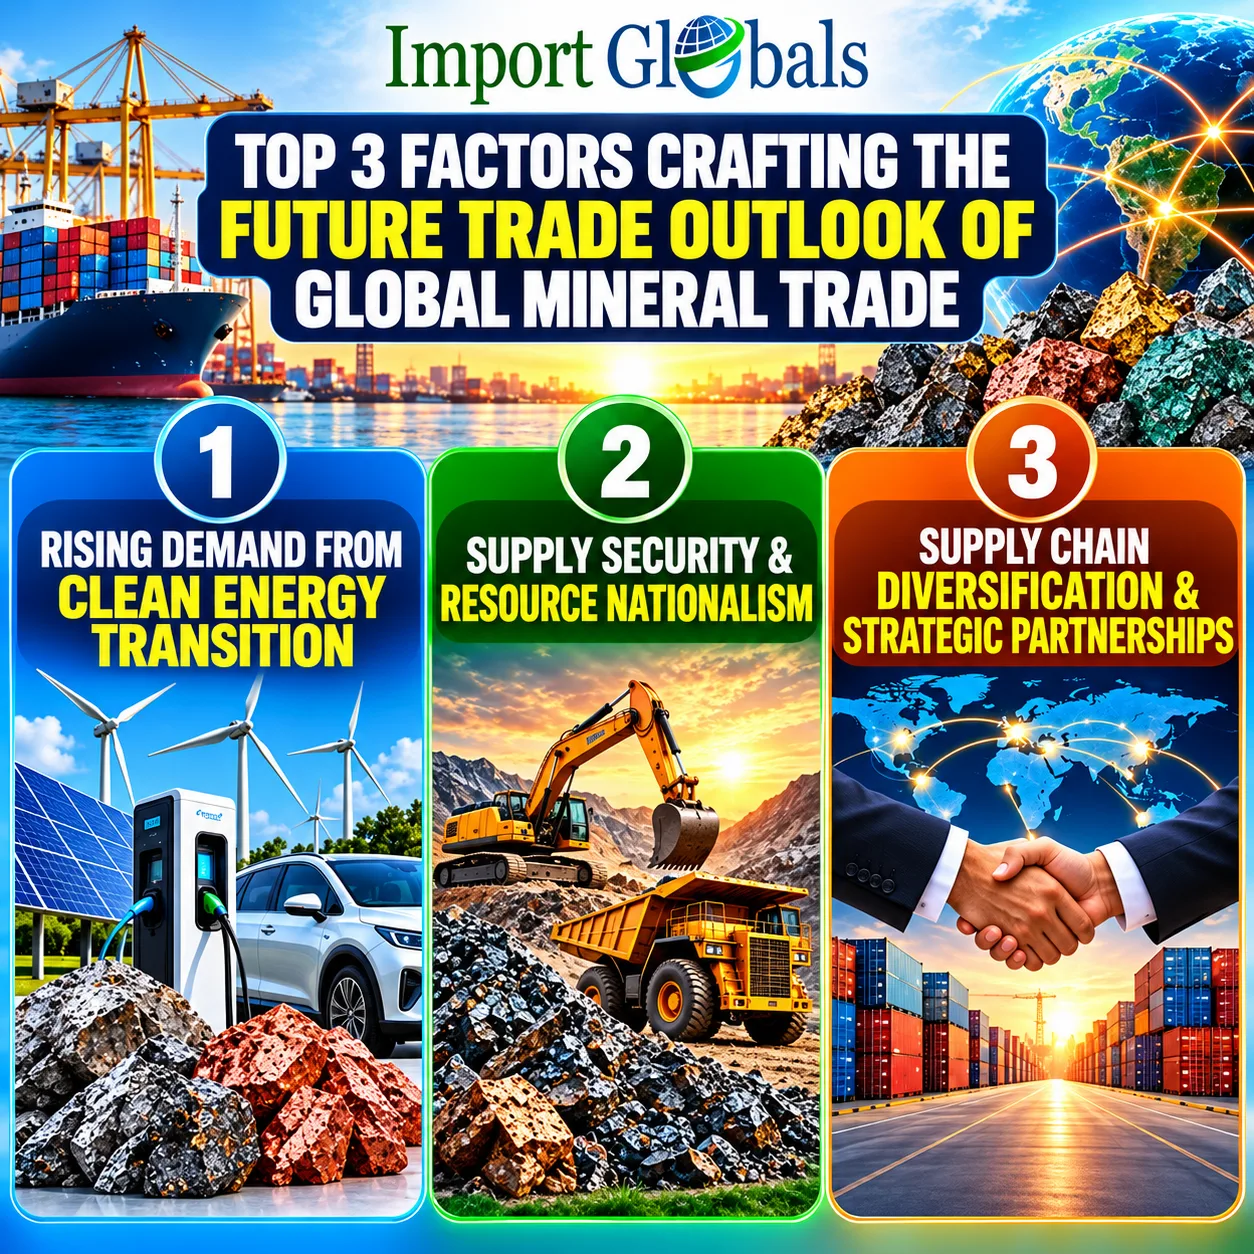
The global mineral trade will experience fluctuations. The trade landscape will be shaped by geopolitical interventions, regulatory frameworks, and the accelerating energy transition. The resource-rich nations will increasingly adapt to resource nationalism, while shifting focus from raw ore exports to local and high-value manufacturing, away from traditional trade pathways.
The trade networks will be mainly expected to fracture into more localized and alliance-centric blocks. The supply constraints and export controls will maintain the upward pressure on critical mineral and fuel prices.
Conclusion
The intersection of critical mineral demand, energy trade, and resource nationalism will fundamentally shape the global mineral trade landscape. Over the past 10 years, the global mineral trade has maintained its immense resilience in the marketplace, as per Global Customs Data. The expansion is mainly due to rising protectionist policies, while resource-rich nations are looking to capture greater economic value. The long-term market stability is dependent on how successfully global producers and consumers are balancing their sovereign economic interests.
CTA
Looking for the latest market expansion opportunities on the global mineral fuel trade? You have come to the right platform. Import Globals helps businesses enhance their market entry strategies with effective trade insights. Subscribe to www.importglobals.com or drop an email at info@importglobals.com for detailed information on global trade to drive your international business strategies regarding critical mineral restrictions.
FAQ’s
Que. What is the total global mineral trade of 2025?
Ans. The total global mineral trade of 2025 is 3.87 trillion US dollars.
Que. What is the HS code for mineral fuels?
Ans. The HS code for mineral fuels is 27.
Que. What is resource nationalism?
Ans. Resource nationalism is the basic interference of government authorities in national resource management, such as export bans, quotas, and state ownership.
Que. Why are different authorities implementing resource nationalism policies?
Ans. Different authorities are implementing resource nationalism policies mainly to capture higher added value and tax revenues through domestic processing factories.
Que. Name the largest importer of metal ores, slag, and ash.
Ans. China is one of the largest importers of metal ores, slag, and ash.
Que. How did the Democratic Republic of the Congo interrupt cobalt market regulation?
Ans. With the temporary export ban on October 16, 2025; the Democratic Republic of Congo has maintained a strict quota system for restricting export volumes.
Que. How does global import-export data support business growth?
Ans. Global Import Export Data support business growth via proper identification of buyers, suppliers, analysis of market demand, and development of effective market expansion strategies.
Que. What information is available in global trade data?
Ans. Global trade data covers importer name, exporter name, shipment date, HS code product details, quantity, pricing information, origin country, importing country, and port details.
Que. How frequently is the global trade data updated?
Ans. Global trade data is updated on a monthly basis.
Que. Where can you obtain detailed information on global trade data?
Ans. Visit www.importglobals.com or drop an email at info@importglobals.com for detailed updates on global trade data.
You Can Also Visit :-
